Monthly Archives: January 2019

The endurance athlete’s guide to fueling and weight loss introduction

Author’s note: I write these posts to further my own understanding and to answer some questions I’ve been asked. I’m not doing it to make money, but since I’ve been asked, if you want to buy me a coffee or an adult beverage, you can do that here.

****

I’ve always been interested in nutrition for athletes, and as a serious recreational cyclist – whatever that means – I’ve played around with a number of different approaches. And I’ve read a lot of books that explain how to do the “standard athlete diet”, and done my best to follow them.

But there were a couple of things that had me confused…

The first was my inability to come up with a nutrition strategy that worked for me on very long and hard rides. Invariably, if I got beyond about 7 hours, I felt sick and weak, and sometimes it happened earlier.

The second was just an observation at first; there were people I rode with who rode a *lot* more than I did but still carried a significant amount of extra weight – 30 or even 50 pounds. I knew from talking with them that they ate like I did, and they were already riding in excess of 5000 miles a year, so more exercise couldn’t be the answer. It was quite the puzzle, but it took getting into my 50s and finding that my weight was no longer easily controlled by cycling and that I was having energy issues in the afternoon to compel me to investigate a bit further.

That led to a period of two years where I learned a lot more about physiology and taught myself enough biochemistry to be moderately dangerous. And changed both my diet and fueling strategy significantly.

And, incidentally, I lost around 15 pounds. I was 178 pounds to start, and at 6’1”, that’s reasonably light, but at 163 pounds, I’m now “cycling light”, and that’s made a big difference on the rides I do.

This series is my attempt to put down the important things that I’ve learned in a coherent manner so that others can benefit from it, and I can get clear in my head what I think I know.

I’ll warn you at the outset; I’m going to be talking about biochemistry because that understanding is pretty critical when we get to talking about strategies and tactics. I have tried to make it “Just enough biochemistry”.

The following is a list of the various posts. I really recommend reading them in order as the later posts build on the earlier posts.

  1. Part 1: Macronutrient intake and storage
  2. Part 2: Energy systems
  3. Part 2.5: More on muscles and energy systems
  4. Part 3: Carbohydrate and fat use in actual athletes…
  5. Part 4: Better fat burning in actual athletes…
  6. Part 5: Hunger etc…
  7. Part 6: Recommendations

The endurance athlete’s guide to fueling and weight loss part 3: Carbohydrate and Fat use in actual athletes…

Please read the introduction and earlier posts if you haven’t…

After two posts of biochemistry, we will *finally* get into some real-world stuff in this post. Thank you for your patience; this is where it gets interesting…

My goal in this post is to talk about what carbohydrate and fat usage looks like in real athletes. How do we do that? Well, luckily the chemistry that is in play when burning glucose (glycolosis) and burning fat (beta oxidation) is different, and it turns out that the amount of carbon dioxide produced for a given amount of oxygen differs between the two. That is expressed as a number known as the “respiratory quotient”.

This is pretty cool. It means we can take an athlete and hook her up to a machine that analyzes the gases that she exhales, and it can tell us how much of her energy is coming from burning fat and how much is coming from burning glucose.

And, if she is on an exercise bike, we can also figure out how much power she is producing, so we can correlate that to the fat and glucose percentages. The setup looks like this, and is commonly done as part of a VO2Max test.

Image result for vo2 max analyzer

Fat and Carbohydrate burn versus intensity

What we would like is a chart that shows the percentage of energy that comes from fat and the percentage that comes from carbohydrate at various intensities. If you’ve ever taken an exercise physiology class or looked into fat burning, you probably came across a chart like this:

Image result for fat versus carbs intensity

This chart says that we burn mostly fat at low intensities, and as the intensity goes up, the percentage of energy from fat goes down and carbohydrate (CHO) goes up. I’ve seen this chart in countless places. And I’ve seen passionate arguments about where you should set your intensity to get the best fat burn; does lower fat burn percentage at a higher intensity burn more fat? etc. etc.

The problem is that this graph is… well, I was going to say it was an idealized model, but I think the term “absolute fabrication” is more correct.  I spent some time tracking down where it came from once, and I think it might have come from a misunderstanding around this article, but it does not reflect reality for pretty much anybody. So any conclusions we might draw from a graph like this will not be worth much.

You might remember in the introduction I talked about being confused by the fact that some endurance athletes carry a lot of extra fat? It was confusion partly driven by this graph; if the graph were true, long bicycle rides at, say, 50% intensity would be great at fat burning for everybody, and we’d expect cycling would make it *easy* for people to lose weight. Right?

So, what do we really see, with actual athletes?

Let’s look at some real data (note 1) from an athlete doing a VO2Max test after an 8 hour fast. Measurements after an 8 hour fast will show an athlete at his or her fat-burning best.

image

The respiratory quotient is calculated at different points during the test, and then the percentage of power from fat and glucose (labelled “CHO” for carbohydrate) is calculated for each point. The amount of power produced is converted to a watts / kg measure using the rider’s weight.

What can we tell from this graph? Well, even in the best conditions for burning fat – after a fast – this athlete doesn’t get more than 25% of his power from the beta oxidation of fat. Even at low intensities, he is getting 75% of his energy from the glycolysis of glucose. I call this pattern “Carb optimized”; great at burning carbs, poor at burning fat.

What causes this pattern? Well, I’ll get more into that later, but as a hint, the source noted that this athlete had a “sweet tooth” and regularly consumed high amounts of refined sugary foods.

Implications

What impact does the heavy reliance on carbohydrates for energy have on this athlete?

I don’t know the rider weights in this data, but let’s just assume the rider is on a long ride at a moderate intensity – say 150 watts. Remembering that 100 watts is roughly 360 calories per hour (note 2), that means at 150 watts, the rider is burning 360 * 1.5 = 520 calories per hour. Of these calories, 390 (75%) come from carbs and only 130 (25%) from fat. And let’s say this rider starts with full muscle glycogen stores of 400 grams = 1600 calories of energy. How long will this rider be able to ride before running out of stored glycogen?

Time until running out of glycogen = 1600 / 390 = 4 (ish) hours

Even at a very moderate intensity, this rider is going to run out of stored glycogen in only about 4 hours (note 3). And then bonk. Having bonked as a high-carb athlete, I can tell you that it is no fun; you lose the majority of your power. Which is no surprise at all looking at the graph; this athlete really needs carbs to put out power.

The glycogen depletion will happen faster at higher intensities; not only is the rider burning more calories per hour, he is also burning a higher percentage of glycogen to get those calories. At 250 watts, it’s 675 calories from carbs per hour, which gives a time to depletion of a little over two hours.

It’s pretty clear that this athlete needs carbohydrate supplementation to continue to exercise so that he won’t totally deplete his glycogen. And if you go here, you will find numerous studies that tell you how great carbohydrate supplementation is for athletes and how much it improves their performance and endurance.

Hmm. Those studies are all linked from – and many are funded by – a company who’s business model is selling flavored sugar water in many and varied forms. The same business model used by most companies that make sports nutrition products. So you’ll forgive me if perhaps I venture to mention that maybe – just maybe – things are a bit more complicated than that.

Keep that thought in the back of your head.

If you do long events, you may have found out that carbohydrate supplementation can cause issues:

  1. If you eat before a ride or try to carb load, you will put yourself into a high-glucose state which will turn off fat metabolism and increase your carb burn percentage.
  2. You are limited in how much food you can digest during exercise because of limitations of blood flow – the blood that is going to your muscles to power them is blood that isn’t available to send to your stomach. This gets worse as the intensity goes up, and can easily make you feel sick.
  3. If your sport involves impact – like running – the mechanics of impact can make it harder to digest food and make it more likely you will have what are politely known as “gastrointestinal issues”.
  4. Trying to balance the need for energy with the digestive issues can be difficult. Too much food and you feel sick. Too little food and you run out of energy.

I’ll use myself as an example. I used to be a low-fat diet carbs before/during/after cyclist, and I followed that advice religiously; even my short 25 mile rides had carbs during and after. Let’s have some fun with some of my data from that period…

(Author’s note: it turns out I used RAMROD data that did not include power data, so the calorie values are likely inflated by about 25%. I will correct it with better data when I get a chance; I do not think it changes the overall message of this section)

Back in 2013 I did a ride named RAMROD, which has about 9300’ of climbing over 150 miles. I have power meter data that ride, and it shows that I burned 5220 calories on the ride and it took me 9.9 hours on the bike to complete the ride, and 12.25 hours elapsed.

What can we do with this data? I charted my actual energy use by minute based on the recorded data, and it’s straight enough that a linear plot works fine, so I’m just going to say that I burned 5220 / 9.9 = 527 calories per hour (I’m using kj but when you factor in conversion and efficiency factors they are pretty much equal to calories).

image

That’s just what I burned moving the bike.  Looking a basal metabolic calculator, it says I burn about 1800 calories per day just sitting on my butt, or a further 75 calories per hour, for a total of 600 calories per hour, give or take.

If we look at both liver and muscle glycogen, I had something like 2000 calories in glycogen reserves. I’m a relatively tall guy with more than average muscle mass for a cyclist, so maybe it’s a bit more, but something in that range. If we assume that I’m getting 75% of my calories from carbs – that I look like athlete #1 – that would mean I’m burning 450 calories of glycogen per hour.

Which would mean I could expect to be able to ride 2000/450 = 4.4 hours before I totally ran out of glycogen.

This is a bit too optimistic… Muscle glycogen is allocated to individual muscles rather than sharable, so any glycogen in my arms, chest, or any other under-utilized muscles doesn’t keep my quads and calves from running out of glycogen. I don’t carry a lot of non-cycling muscle, so I’m going to make a guess that 25% of my muscle glycogen is in muscles that I’m not really using for the ride – or if I am using them, it’s not actually going to physically moving the bike forward. That would drop me down to 1600 calories in my glycogen stores, and 1600 / 450 = 3.6 hours.

I normally targeted 200-300 calories per hour while riding.

With all that in mind, what do my glycogen reserves look like during the ride?

image

The blue line shows what happens if I start with full glycogen reserves and eat 200 cal/hour of carbs, the orange if I eat 300 calories per hour. At 200 cal/hour, I will run out of carbs just before 7 hours, while at 300 cal/hour, it will be just before 11 hours.

This chart is by no means perfect, but it basically says that if I can eat 300 calories per hour I’m probably going to be okay until right near the end, but if I can only get in 200 calories per hour, I’m doomed to be really unhappy at around 7 hours in.

Hmm. It turns out that in RAMROD I would feel fine on the first 3000’ climb, but when I got to the second climb – at 92 miles and roughly 7 hours in – I was pretty sure to be a) feeling weak and b) feeling a bit sick to my stomach. Not really what you want when you have 3250’ of climbing in front of you, often in the summer sun and heat. And after being off the bike for an hour at the deli stop at 120 miles after that climb and getting a lot more food in me, I generally felt quite a bit better.

My assumption was always that I wasn’t well enough trained for a ride this long or hot – both of which are probably true – but from a fueling perspective, if I wasn’t eating enough I was going to be very unhappy. Compounding this is that it’s hard to fuel on a ride with big climbs; I can only eat a little on the climbs or you get sick, and trying to eat is contraindicated on mountain descents at 35 MPH.

What does all this mean?

If you get most of your energy from carbohydrates, you are going to have a deficit between what you burn and what you can replace, and you will eventually run out of stored glycogen. Remember when I talked about the asymmetry between the two systems? The limited supply of stored glycogen is a big issue on long events if you burn a high proportion of carbohydrates.

Another athlete

Back to the data. Here’s a second athlete:

image

Note that this athlete manages to get 40-50% of his power from fats up to about 3 watts/kg. What factor or factors do you think accounts for the difference in fat burning between these two athletes? Write down what you think is the cause, and I’ll continue in the next post.

Post 4: Better fat burning in actual athletes

Notes:

  1. All of the graphed data is from this excellent article from CyclingTips, though I have regraphed it.
  2. 100 watts is 100 joules per second, and there are 3600 seconds in an hour, so that would be 100 * 3600 = 360,000 joules per hour, or 360 kj per hour. Now we need to convert that to calories. One kJ is about 0.24 calories of energy, so that would mean 360 kj/hour is 90 calories/hour. However humans are 20-25% efficient in turning food energy into mechanical movement, so it takes about 4 * 90 calories/hour of food to get 90 calories/hour of work out. This is really just a very convenient coincidence, and because of it pretty much everybody just acts as if the kj/hour is the same as the calories/hour value. It’s close enough.
  3. It is actually worse than this. One of the interesting features of muscles is that while they can absorb glucose and store it as glycogen, they lack the biochemistry that would allow them to take that same glucose and release it back into the bloodstream. What that means is that the muscle glycogen in your biceps cannot be shifted to your legs.


The endurance athlete’s guide to fueling and weight loss part 1: macronutrient intake and storage

If you haven’t already, I recommend reading the introduction

We’re going to start by going into the biochemistry of how the various macronutrients – fat, protein, and carbohydrate – make it into our bloodstream and how they are stored.

I’ve simplified the biochemistry as much as practical. If you want more details, you can start with the chapters about fat and carbohydrate metabolism in Marks Medical Biochemistry, but I’ll warn you that biochemistry is annoyingly complex.

Digestion and Storage

Fat

When we eat fat, we are eating triglycerides, which look like this:

Image result for triglyceride

Triglycerides are simply 3 fatty acids hooked to a glycerol backbone. The fatty acids are just chains of carbons with hydrogens attached to them and then what’s called a hydroxyl group (pink in the image) at one end. Discussion of fats is imprecise; sometimes we talk about “fats”, sometimes “fatty acids”, and sometimes “triglycerides”. You can treat all those as equivalent for this discussion.

The fatty acids shown here are saturated fatty acids; the differences are mostly immaterial for the purposes of this series, so I’m going to ignore them.

After digestion, fatty acids end up in the bloodstream, our adipose (fat) tissue pulls them in, and stores the fatty acids away. Very simple and the system works quite well.

The amount of energy you can store in fat cells is close to unlimited. Even only 10 pounds of fat stores about 35,000 calories, which is a ton of energy; that’s about 1000 miles of riding for the kinds of rides that I do.

Protein

The protein in the food we eat is broken apart into individual amino acids, absorbed into the bloodstream, and… Well, at that point it gets a little weird.

There is no centralized storage for protein in the body. There is a what is called the “amino acid pool” in each of the cells, but generally speaking, if we eat more protein than is immediately usable by the cells, the rest is excess. Most of the excess amino acids can be converted to glucose through a process known as gluconeogenesis, so some of the excess energy becomes blood glucose, but if there is too much, it is just thrown away.

Now, if you look at it another way, you can view muscles as a centralized storage for protein. There is something known as “protein sparing” where the body generally tries not to tear apart muscles to get energy, but if the need is great, the body will tear down protein, convert it to glucose, and burn it. If you’ve seen the pro cyclist upper body muscles, you can see this effect in action.

Carbohydrate

Carbohydrates are much more complex; unlike the fat system, where all fatty acids are treated equally, the different sugars are treated quite differently. I’m going to talk about how the various sugars get into the bloodstream and what form they take before I talk about storage.

Glucose

Image result for glucose

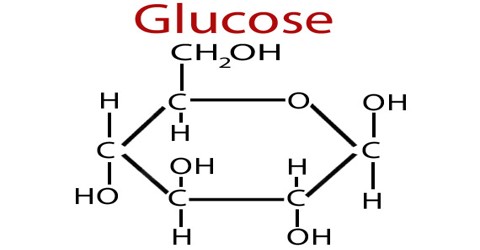
Glucose is one of the common currencies for energy in the body. When you eat glucose, it is absorbed into the bloodstream.

Starch/Maltodextrin/Dextrose

These are sometimes known as “glucose polymers”, which is a fancy way of saying “chains of glucose”. The chains are broken apart into glucose in the digestive system before they are absorbed and that generally happens fairly fast.

You can treat dextrose, maltodextrin, and most starches as if they were glucose from a nutritional perspective. There are a few exceptions; there is “resistant starch”, which doesn’t get digested easily and can be converted to fat in the digestive system by bacteria, and a cool product known as SuperStarch that I’ll talk about in a later post.

Sucrose/Fructose

Sucrose is a disaccharide, which means it’s a compound of one molecule of glucose and one of fructose. You can treat the glucose part just like any other glucose molecule.

The fructose part is more complex. Some fructose may get digested into fat in the digestive system, but the fructose that makes it into the bloodstream cannot be used directly by the cells of the body. Rather than waste that energy, the liver takes the fructose molecules and does a bit of processing on them. If glucose is rare (blood glucose is not high), the resulting compounds will become glucose, and if glucose is common, it will convert those compounds into fatty acids, which is released (if you are lucky) or accumulates (if you are not lucky). More on that later.

High fructose corn syrup is about 55% fructose and 45% glucose, so it’s pretty close to the same mixture as sucrose and from a dietary perspective, you can treat it the same.

I should also note that some people have varying degrees of fructose intolerance; it can cause what is politely known as “digestive issues”. If I eat any fructose during exercise I will get immediate stomach issues. I mention this because it took me a long time to figure out.

Lactose

Lactose (milk sugar) is another disaccharide, in this case a combination of glucose and galactose. The glucose is like any other glucose, the galactose is like fructose in that it can only be handled by the liver.

Alcohol

What we call ‘alcohol’ – ethanol – is lumped together with other carbohydrates even though it is not a sugar. Ethanol can only be metabolized through the liver, and like fructose and galactose, it might end up as glucose or it might end up as fatty acids.

Blood glucose levels and glucose storage

Much of the physiology we’ll talk about is driven by blood glucose levels. There are two big things to know:

Thing 1: There is a narrow range for healthy blood sugar levels

When blood sugar is not in a narrow range, bad things happen. Normal fasting blood glucose levels are around 80 mg/dL (milligrams per deciliter). If you get below 50 or so, you can end up in a coma, which is bad; that is what happens to type I diabetics if they get too much insulin. If you get above about 215, you need to seek medical attention, and above 300 is an immediate risk. And moderately high levels on an ongoing mean that you have type II diabetes.

Thing 2: The quantity of glucose in the bloodstream is small

How much glucose is in the blood? Knowing that an average fasting blood glucose is 80 mg/DL and  that the average adult has about 5 liters of blood in their bloodstream – 50 dL – we can do some very simple math:

glucose content of blood = 80 mg/dL * 50 dL = 4500 mg = 4 grams

How much is that? About this much:

Image result for sugar cube.

One small sugar cube. There is a *tiny* amount of glucose in the bloodstream.

The small range of normal blood glucose levels plus the small amount of glucose in the blood means that even a modest amount of glucose coming in from the outside could have a huge effect on blood glucose levels; a mere 4 grams of glucose would double the blood glucose level if there were no mechanism to deal with the extra glucose. The body therefore devotes significant amounts of machinery to try to keep blood glucose constant.

Blood glucose level is regulated by the pancreas. As the cells of the body pull glucose out of the blood, the level drops, and the pancreas releases the hormone glucagon. The glucagon signals the liver to release some of its stored glucose into the blood stream to bring the blood level back to normal. The liver can store about 100 grams (400 calories) of glucose, which it stores as glycogen. If the liver glycogen stores are chronically low – if you aren’t eating many carbs on an ongoing basis – the liver can make glucose from other compounds – like lactate, the glycerol from triglycerides, and some amino acids from protein – using process known as gluconeogenesis – and it can also switch some tissues to use ketones rather than glucose to reduce the required amount. If you aren’t eating anything – if you are fasting or starving – your body can still make the carbs you need.

Low blood sugar is the less interesting case, because the body is (generally) quite capable of dealing with it. The more problematic part is high blood glucose…

If you eat something with carbs, as they are digested you will end up with glucose coming into the bloodstream. The pancreas detects the raised blood sugar, and starts releasing insulin, which is a signal to other tissues to do their best to pull glucose out of the blood. There are 3 main effects from the elevated insulin:

First, the burning of fat is minimized so that as much glucose can be burned as quickly as possible. The more glucose being pulled out of the blood, the less the blood glucose level will rise.

  • Second, the liver will start pulling glucose in and storing it as glycogen, as long as it has space. The muscles will also start pulling glucose in if they have space to store it, and the muscles can store around 400 grams (1600) calories. Conversion from glucose to glycogen is quick and there are a lot of liver and muscle cells, so if glycogen stores aren’t full, the glucose will quickly be pulled into those cells, and blood sugar won’t get very elevated. But compared to fat, the storage is quite limited, and it’s very rare that glycogen stores are low; muscle glycogen is only burned through activity, so it’s generally only the liver storage that is in play, so there’s often just not much space to store glycogen. 
  • The third effect happens if the liver and muscle glycogen stores are full. There is no easy place to store the glucose but it’s still coming in from the digestive system, so the blood glucose level goes higher and the pancreas releases more insulin. There is only one place for this excess glucose to go, and that is fat, so the liver and the fat tissue pulls in glucose and converts it to fat. This is slower than the conversion to glycogen, so the elevated blood sugar and insulin levels persist for a few hours.

    Because that it is highly important to keep blood glucose low and limited storage space, there is a fundamental asymmetry between the fat and carbohydrate storage systems, and that asymmetry drives a lot of the physiological response.

    The big upshot of this – the reason I’ve talked so much about the underlying biochemistry – is that the two big effects of lots of carbs are a) converting excess carbs into fat and b) turning off fat burning while that process is happening. If you’ve ever “carb loaded”, you deliberately put yourself into this situation. It *does* push a little more glucose into your glycogen reserves, but most of the excess carbs just go straight to fat. Will they stay as fat? Well, that question will be covered in a future post…

    Insulin Resistance and type II diabetes

    It seems like an appropriate point to talk about what is different for people who have insulin resistance or type II diabetes.

    The previous explanation is how it works if you are metabolically healthy – if you don’t have insulin resistance / type II diabetes.  Here’s a graph:

    The normal person sees just a small spike of glucose and it quickly returns to normal, the pre-diabetic sees a spike and then a drop afterwards (this is likely not true for all pre-diabetics), and the type II diabetic starts with an elevated glucose level and a meal just spikes it way up.

    Part of what we are seeing is that the liver and muscles become less willing/able to absorb glucose out of the bloodstream, so it takes longer for the blood glucose to return to normal. When we get all the way to type II diabetes, there is something else going on. Earlier I talked about the process to deal with low blood glucose by converting liver glycogen to glucose. This normally only happens when blood glucose is low, but insulin resistance messes up the machinery that controls this, and the liver will release glucose even when glucose is normal or elevated. That is why the blood glucose is chronically high.

    The result is that those who are insulin resistant have chronically elevated levels of glucose and insulin, and since we know that elevated insulin reduces fat burning, they find it very hard to burn fat.

    Insulin resistance is not a binary thing, and it’s possible to be a little insulin resistant and not have it show up in standard tests. It is not confined to people who are overweight; it is possible to be insulin resistant and have a normal body weight.

    Summary

    Protein and fat digestion and storage are pretty simple, but because of the limited storage available for carbs, excess carbs just get stored as fat.

    Now that we’ve gotten that fat and glucose stored, in the next post we’re going to talk about how those are used by the muscles.

    Appendix

    This section contains some related information that isn’t necessary for the discussion but may be of interest…

    Protein and insulin

    I glossed over the relation of insulin to protein earlier in the post, but it comes up often enough I thought it was worth covering here.

    Insulin is a multipurpose storage hormone; not only does it signal the body to store glucose, it also signals it to store protein.

    But how can that work? Let’s perform a little thought experiment:

    We eat a high protein meal and the pancreas secretes insulin. That would cause the amino acids from the protein to be absorbed, but it would also tell the liver, muscle, and fat cells to pull glucose out of the bloodstream, and would therefore cause the blood glucose to plummet.

    Which would be bad.

    This is one of the simplifications that I made to keep things simpler. It turns out that the liver, muscle, and fat cells are not sensitive to the amount of insulin in the blood but rather to the ratio of insulin to glucagon in the bloodstream. Here’s a graph for what happens after a carbohydrate-rich meal:

    Image result for insulin glucagon protein meal

    Notice the inverse relationship between the insulin and glucagon values; this will move the insulin/glucagon ratio much higher so the glucose will be absorbed.

    Here’s what happens with a protein-rich meal:

    Image result for insulin glucagon protein meal

    There is a small insulin spike from the protein, but a large glucagon spike. That keeps the insulin/glucagon ratio low and blood glucose constant.


    Countertop CAD CAM

    One of the leftover tasks from a bathroom remodel is to put a countertop on one of the small storage cabinets:

    IMG_9414

    We originally were going to have somebody fab a piece for us, but it’s a small job and they never really got back to us. So, it sat like this for a *long* time, but now it’s time to get moving on it.

    After considering marble, we settled on doing solid surface because I can fabricate it with the tools that I already own. A little research took us to solidsurface.com, where we found a nice leftover piece of countertop in a color known as “Oregano Sand”, which we hope will go well with the overall color palette. That won out over white because we already have a white toilet and sink. A 20” x 43” x 0.5” piece was $116.33, and since I’m going to do a built-up edge – so it’s a full 1” thick on the visible part – I also picked up a tube of adhesive that is mostly color matched to the color of the material.

    The fabrication approach I had planned was pretty simple:

    1. Carefully measure the size of the base and add 5/8” on the sides and front.
    2. Cut the solid surface piece on the table saw to the exact dimensions needed
    3. Round the left and right corners.
    4. Notch the left-back part to fit around the door trim
    5. Glue on other pieces underneath the top with them sticking out a bit.
    6. Trim the new pieces with a router and a bearing string-cutting bit so everything matches
    7. Round over the top edge with a rounding over bit.

    The downside of this is that I’ll need to be doing some cutting on the table saw, and that’s not my most accurate tool, and I’ll likely need to do some sanding to clean things up.

    I was also going to say that notching out the corner for the trim would be a big pain, but I just now realized that the cabinet is only held in place by two screws into a stud, and it would be absolutely trivial to slide the thing over to the right by 5/16” and eliminate the notch.

    But anyway, I don’t like doing the big things on the table saw.

    And then I realized that I could easily just do a CAD design for the countertop and cut it out on my shaper origin. That will give me very good tolerances and there’s no reason to expect that it won’t require less rework than the table saw, and there’s much less chance I’ll slip and do something bad.

    So, I went of and did some Fusioning, and came up with the following:

    image

    A simple base that is the side of the cabinet, and then a counter on top with nice 1/4” rounded corners on the front and a little notch at the back. I’ll be getting rid of the notch since I decided to just move the cabinet over slightly.

    I’m currently missing the pieces that will be between the countertop and the cabinet to make the edge thicker. I’m going to model them on top of the countertop as that will be simpler to do. It ends up looking like this:

    image

    Note that there are three built-up pieces, each 3” x 19.25”. That allows them to overhang the front by 1/8” and overhang the sides by 3/16”.

    Fabrication

    I decided to use the shaper origin to do the fabrication:

    IMG_9418

    That solid surface stuff is *hard*, it’s a bit like working in hardwood. I ended up only cutting 3mm at a time.

    In retrospect, the shaper wasn’t the best choice for this; the size was fine but the edges weren’t as smooth as I had hoped. But they were close enough.

    To do the layup, I needed the following items:

    IMG_9423

    The glue is a two-part color matched adhesive. And that presented a problem; the glue is in two parts, and they need to be dispensed in equal ratios. Real installers have nice guns (like caulking guns) that dispense both at the same time and run them through special mixing nozzles, but I didn’t want to buy a gun just for one use.

    So, I built that little bolt thing that the knife is sitting on. I’ll open the tube and then use it to press the piston in the correct amount on each of the tubes, and then mix it together. Here’s what it looks like in use:

    IMG_9425

    This worked really, really well; both liquids are fairly fluid so it pressed out easily.

    A large amount of color-matched (mostly) adhesive, a tiny bit of hardener:

    IMG_9426

    This stuff is really, really smelly; tons of volatiles; you want good ventilation and/or a good chemical mask. After a good mixing, I started spreading it onto the build-up pieces and putting them onto the big piece. This worked fairly well except that they want to slide sideways.

    And then it was time for lots of clamps:

    IMG_9427

    Closeup:

    IMG_9429

    Here’s the worst edge. Yes, it’s not parallel, no it’s not a problem:

    IMG_9430 

    The buildup parts are trimmed to be the same as the big piece using a router and a bearing bit. This went quite well, and produced a lot of chips that were like the fake snow you see at Christmas.

    Here’s a long edge. Wavy wavy wavy; that’s from the shaper not tracking perfectly. Nothing that a ridiculous amount of sanding won’t fix. I stuck with the random orbit because I didn’t want to risk worse gouges with the belt sander:

    IMG_9435

    Once all the sides were square, the edge was rounded over with a 1/4” roundover bit with a bearing:

    IMG_9438

    Then sanding, sanding, sanding to get rid of the ridges and sand out the scratches from the router table. Worked my way through grits, 80/100/150/220/320. Here it is mostly cleaned off:

    IMG_9440

    and installed on top of the vanity with clear silicone adhesive. The color looks quite nice against the accent tile.

    IMG_9441


    Clopay Pinchproof door hinge #1

    When we first bought our house nearly 20 years ago, one of the first things we did was to replace a 20-year-old wood garage door with a nice sectional from Clopay.

    This door used a proprietary design known as a “pinchless” design; rather than using a simple  hinge that attaches to the two parts of the door, they designed a hinge where the top part is attached to top door upper door panel, and then there are little arms that are attached to the lower panel with a steel pin. Each hinge is slightly different.

    Over the years I’ve had a few hinges break; it’s really common for one arm of the hinge to come off of the little pin, which puts more pressure on the other side. Over time, that side will break, and the door will start working poorly, and the failure may cascade to other hinges.

    I broke 3 or 4 hinges, and whenever that happened, bought a new hinge and replaced it.

    Last month I found that another hinge had broken, searched online, and found out that Clopay has not only discontinued that design, they have stopped making replacement parts and. You can find some of the hinges available, but not the #1 hinge that I wanted.

    I tried a jury-rig that rapidly failed, thought about a new door ($1000, no thanks), and then decided to fabricate one myself. My goal is to beef it up with slightly thicker sheet metal and make the arms that keep breaking wider.

    Reverse engineering

    To start, I need a design that I can work from, so I started by pulling the hinge off and making a pattern:

    IMG_9442IMG_9443

    From that I did a tracing to get the format, and got out the calipers to measure holes and other parts directly. Here’s what I ended up with:

    IMG_9444

    At this point, my first thought was to do a quick drawing, print it out, and just transfer it to a piece of sheet metal – somehow – and then do the machining to create the piece.

    I’ve done that sort of thing in the past, but the problem is that it’s hard to get the layout right, and if you mess it up you can easily ruin a lot of work. Is there a way to make it more foolproof?

    CAD

    The obvious solution is to do what I would call a real design. So I sat down with my drawing, a ruler, and calipers, and fired up Fusion 360.

    First off, I draw the outline as two separate bodies.

    image

    This is pretty close, though the end of the arm is square rather than rounded. I wanted more beef on the arm, so I’ll add that in next:

    image

    Throw in some filets, join the old and new parts together, and we get the following:

    image

    Now we need some holes:

    image

    The locations of the holes are pulled from my drawing, and the sizes come from direct measurement of the holes in the current hinge. The little tab on the hole in the arm is there because the pin that goes through has a little tab on it for retention.

    Mirror across a plane in the middle, do some cuts, do some combines, and we end up with the following:

    image

    I then exported that to an SVG file using the Shaper Origin plugin for Fusion. You can find the SVG here.

    Manufacturing

    I took the design and printed it out, and then put it behind my traced design and held them up to the light to verify that things were in the right place.

    The next task was to transfer that design to metal. The way that real machinists do this is to put layout dye on the metal and then scratch the design onto it. I don’t happen to have any dye lying around nor am I experienced at this.

    But I do have a laser cutter. Steel is very reflective of infrared so I can’t mark it with my laser cutter, but maybe there is something I can put on it that I can ablate away?

    IMG_9445

    So, I grabbed a sharpie, applied it to a large enough area, and went out to the laser cutter to see if I could ablate it away.

    It was an absolute failure, even at powers that would easily cut 1/8” wood. Not enough IR absorption to work.

    So, I grabbed a can of black spray paint I had, went outside, and put a nice easy full coat on the steel. And then put it in from of a heater to dry:

    IMG_9446

    Then a few tests, and even at 25% power and my fastest speed, it still worked well:

    IMG_9447

    and ran the drawing:

    IMG_9452

    Machining

    First, I cut off the part with the design and scraped the hell with the base of my jigsaw:

    IMG_9453

    I cut the holes incrementally, starting at 1/16” and working my way up. I high recommend drilling them from the back, since if you drill them from the front the shaving will scratch off a lot of the paint.

    IMG_9454

    Next, I cut the outline with the jigsaw. I also scribed on some bend lines that I will need later:

    IMG_9455

    Starting to actually look like the drawing. I drilled a starting hole in the waste in the middle bottom, cut out the long sections with a jigsaw, and then rounded off the pieces with a grinder:

    IMG_9457

    A bit more cleanup with an angle grinder and a dremel, and we end up with the following:

    IMG_9459

    A couple minutes to fold the bracket and pull off the old one:

    IMG_9463

    The final step is to take the tubular mount of the wheel and move it from the old mount to the new one. The tube is flared out; I unflared it by pounding it on the vice and then expanded it back out with a flared socket adapter. If I had a copper tubing flarer, that would have been a better choice. And, we’re done:

    IMG_9464

    And the quick reinstallation:

    IMG_9468

    On the left side you can see the end of the pin sticking out.


    Review: MITx: 16.885x–Engineering the Space Shuttle

    This fall I decided to spend some of my free time doing something different, so I signed up for an Edx/MITx online course on the Space Shuttle.

    It was fascinating. If you have any interest in the details of how the Space Shuttle from an engineering standpoint, you will love this course. The course is run/hosted by former astronaut and MIT professor of aeronautics and astronautics Jeff Hoffman, and wherever possible the actual lectures are done by ex-shuttle engineers or managers. Main engines? Lecture by J.R. Thompson, manager of the Main Engine Projects office at Marshall. Flight control system? Phil Hattis, one of the leads on the system. Mission control? Wayne Hale, flight director for 41 missions. Saturn and shuttle? Chris Kraft.

    A brief overview:

    Section 1: How the Space Shuttle was Originally Designed and Approved

    • Lecture 1: Origins of the Space Shuttle – Dale Myers
    • Lecture 2: Development of the Space Shuttle – Aaron Cohen
    • Lecture 3: Early History of the Shuttle and NASA’s Relationship with the Military – Bob Seamans
    • Lecture 4: Political History of the Space Shuttle – John Logsdon
    Section 2: Space Shuttle Sub-Systems
    • Lecture 5: Introduction to Space Shuttle Orbiter Subsystems – Aaron Cohen
    • Lecture 6: Orbiter Structures & Thermal Protection System – Tom Moser
    • Lecture 7: Space Shuttle Main Engines – J.R. Thompson
    • Lecture 8: Space Shuttle Aerodynamic Design – Bass Redd
    • Lecture 9: Aerothermodynamics – Bob Ried
    • Lecture 10: Space Shuttle OMS/RCS APU/Hydraulics – Henry Pohl
    • Lecture 11: Thermal Control and Life Support System – Walt Guy
    • Lecture 12: Mechanical Systems and RMS – Alan Louviere
    • Lecture 13: Shuttle Flight Control System – Phil Hattis
    • Lecture 14: Systems Engineering Review, Matrix Management, and Cost Estimation – Aaron Cohen

    Section 3: Operating the Space Shuttle

    • Lecture 15: Space Shuttle Training and Mission Description – Jeff Hoffman
    • Lecture 16: Payload Operations and Systems Engineering – Tony
    • Lecture 17: Space Shuttle Launch Operations – Bob Sieck
    • Lecture 18: Space Shuttle Abort Modes, Payload Bay Doors, EVA – Jeff Hoffman
    • Lecture 19: Mission Control – Wayne Hale
    • Lecture 20: Test Flying the Space Shuttle – Gordon Fullerton
    • Lecture 21: Columbia Accident – Sheila Widnall
    • Lecture 22: Hubble Space Telescope and the Space Shuttle – Jeff Hoffman
    • Lecture 23: Apollo and the Space Shuttle – Chris Kraft
    • Lecture 24: Retrospective on the Space Shuttle – Jeff Hoffman/John Logsdon/Wayne Hale


    Tell me more about trans fats…

    Trans fats are fats which have a specific chemical structure…

    Saturated fats are called “saturated” because they have as much hydrogen in them as possible, so they are very simple structurally; just like a long column. Because of that, they fit together very nicely and that is why saturated fats tend to be solids at room temperature.

    This picture shows three fatty acids; the top on is saturated, and notice how it is nice and straight.

    Unsaturated fats have fewer hydrogen molecules; at specific places in the chains of carbon atoms there are missing hydrogen atoms. Monounsaturated fats have one spot, polyunsaturated have two or more. The connections between those carbon atoms become what are called “double bonds”. One of the features of double bonds is that they are easier to break; that is why unsaturated and especially polyunsaturated fats go rancid easily, and that is why there is concern with using them for deep fat frying; those bonds can be broken, the broken parts can be oxidized, and you end up with a nasty compound called an “aldehyde”.

    Because of the physics of how things work, there are two ways that double bonds can occur. The “normal” way – the way that is found in the majority of unsaturated fatty acids – is what are called “cis” bonds. These bonds are at an angle, so unsaturated fats have one or kinks in their structure; see the middle fatty acid, which has two double bonds. Because of that kink, they don’t fit together very well, so they are liquids at room temperature.

    Where the first double bond occurs matters biologically; that is described by counting the number of carbon atoms before the first double bond, and that is known as the “omega” number. If we look at the picture, we will see 6 carbon atoms before the first double bond, so this is an omega-6 oil.

    Trans fats

    The fats that are produced by plants or animals are either saturated fats or unsaturated fats with cis bonds; that is why I called it the “normal” way.

    But there is another way that the double bond can occur; it is called a “trans” bond, and that is where the term “trans fat” comes from. Instead of a big kink, there is just a little jog in the structure. This turns out to be important biologically.

    There are some natural trans fats; it turns out that there are bacteria that can produce trans fats. These bacteria live primarily in ruminant animals, which means that if you eat dairy products like cheese or the flesh of ruminants, you will get some trans fats. It is not clear where the natural trans fats are problematic or not, but the research I’ve seen suggests that the answer is “probably not”.

    Which takes us to artificial trans fats. Producers of polyunsaturated vegetable oil wanted to expand their markets so they could sell more, but the usages of the oils were limited because they were oils. It was discovered that if you heat up polyunsaturated oils under high pressure where there is a lot of free hydrogen, you can “hydrogenate” them and make them more saturated. If you fully saturate them, you just end up with a saturated fatty acid that is the same as a saturated fat from plant or animal sources.

    But, if you take a polyunsaturated oil and partially saturate it – partially hydrogenate it – it turns out that some of the remaining double bonds will flip from “cis” to “trans”, and you have an artificial trans fat. Which is pretty bad.