Browsing posts in: Nutrition

Exercise, Weight Loss, and Low Carb Performance

This is the companion post for the presentation that I did of the same name.

I’ve written about these topics fairly extensively; if you want the longer version you can find it here. The video is intended to be more approachable and more practical than the ones I’ve done in the past and bring in some additional information about different muscle fiber types, their use in different kinds of sports, and how that might impact your fueling strategy.

References

The pretty graph that I complain about in the presentation comes from the following study:

Metabolic Factors Limiting Performance in Marathon Runners

The data for the graph came from this study:

Regulation of endogenous fat and carbohydrate metabolism in relation to exercise intensity and duration


The endurance athlete’s guide to fueling and weight loss part 2.5–More on muscles and energy systems


The Dual-fuel system revisited…

In one of the earlier parts, I talked about how muscle contraction is fueled either with glucose (glycolysis) or fatty acids (beta oxidation). I have since realized that there is more detail that I’d like include, so this is a part II of that post.

The phoshagen system uses stored creatine phosphate in the cell to create the ATP that ultimately drives the muscles. This can provide a *lot* of energy, but is limited to durations of 10-15 seconds because of limited supply of creatine phosphate in the cell. This is the system that is used for explosive power – weight lifting, sprinting, etc.

The glycolytic system uses glucose to create ATP. Strictly speaking – and this is a point I glossed over earlier – glycolysis only goes from glucose (or glycogen) to pyruvate. This step can occur both in the mitochondria and in the the cytoplasm of the cell, which means it can produce quite a bit of ATP quickly, but it’s only the first step in the full process of burning glucose. To keep the energy production high, something has to be done with the pyruvate, and it is converted to lactate. That lactate accumulates quickly, and that is what is making our muscles hurt during hard efforts.

The oxidative system – also termed “oxidative phosphorylation” or “mitochondrial respiration” – is the main energy provider for aerobic exercise. As discussed earlier, there are two feeds into the TCA/citric acid cycle:

Beta oxidation takes fatty acids and converts them to Acetyl CoA to feed into the TCA cycle. Or, we take the products from glycolysis and feed them into the same cycle. The important point is that those products can be pyruvate that was just created by glycolysis, or it can be lactate that was created during glycolysis elsewhere in the cell.

That’s enough context to now discuss different intensities:

At a moderate aerobic pace, we are getting all of our energy from the oxidative system; we are either converting fatty acids to Acetyl CoA or performing glycolysis to get pyruvate which is immediately fed into the TCA cycle.

As we increase the intensity, we need more glycolysis to produce more energy, and for that to keep working, we need to convert the pyruvate to lactate. That means we have more lactate around that we will need to feed into the TCA cycle to get rid of. That can happen both in the muscle that is exercising, but also in other muscle that is resting and in the liver and heart. At some point, the amount of lactate produced exceeds the body’s ability to get rid of – or “clear” – it, and tissue and blood levels of lactate increase much faster. That is what the term “lactate threshold” means, and a lot of high intensity training is looking to improve lactate clearance.

If we increase the intensity above the lactic threshold level, we accumulate lactate very quickly, and that means we cannot continue for very long.

Here’s a cool image that shows the relative contributions of the different energy systems:

Training intensity and fat loss

Knowing that is only burned by the oxidative system tells us something important about intensity; we can only burn fat at moderate intensity. The definition of “moderate” is going to vary quite a bit based on the availability of glucose during our endurance training, but one we have hit an intensity that maxes out beta oxidation, we will not be burning any additional fat. Extra intensity above that level will just lead to more glucose being burned.

For the longer term, we could improve our ability to burn fat by improving our ability to perform beta oxidation.

Muscle Fiber Type and energy sources

image_thumb.png


Muscle fibers can be categorized in a number of different ways; you may have heard them categorized into “slow twitch” and “fast twitch”. Slow twitch (type 1) fibers are utilized in longer-term exercise, and – since they have a lot of mitochondria – they can do a lot of aerobic metabolism, and therefore can be powered on fat. Fast twitch (type 2b) fibers have few mitochondria, and run mostly on glucose. And then the type 2a fibers are hybrids, though it probably makes more sense to think of muscle fiber type as a continuum rather that a set of discrete types.

What this means for our topic is that if you are doing the sorts of activities that recruit a lot of fast-twitch fibers, that’s going to require a lot of glucose. And therefore, you won’t burn a much fat from those sorts of activities, nor will you be able to do those activities well if you are very limited in glucose.


Part 3: Carbohydrate and Fat use in actual athletes…


References

Interaction among Skeletal Muscle Metabolic Energy Systems during Intense Exercise


Just enough biochemistry – Insulin resistance and Gluconeogenesis

Disclaimer: “Just enough biochemistry” means I’m going to be simplifying what is some very complex biochemistry. Sometimes the omitted details are going to matter.

****

There’s this weird thing that happens as part of insulin resistance that I don’t think gets discussed often enough, and since I think it drives much of what is bad about insulin resistance, I’m going to discuss it here. We’ll start with glucose metabolism:

Elevated blood glucose / elevated insulin

When blood glucose is elevated, the pancreas secretes insulin, and that changes how the body’s metabolism operates:

image

Insulin is a signal to pull excess glucose out of the blood. The body has 4 ways to do this, shown as purple arrows in the diagram. The are, from the right to the left:

  1. Store it as muscle glycogen. There are a lot of muscle cells in the body and the conversion to glycogen is quick, so they can take up a lot of glucose quickly – that is is why the arrow is so big. But their ability to take up glucose is dependent on how much glycogen they already are storing – how much space there is for new glycogen. There be a lot of extra space after a long run and very little space after a few hours watching TV.
  2. Store it as liver glycogen. The liver can’t store quite as much glycogen, but it can still store it pretty quickly.
  3. Burn it as it comes into the bloodstream. The size of this arrow depends on what you are doing; if you are just sitting it’s pretty small, if you are exercising it can be bigger. With high insulin the body will choose to burn more glucose and less fat; notice the small size of the fat arrow.
  4. Convert it to fat. Excess glucose that can’t be handled in the other ways will be converted to fat and stored through a process known as “de novo lipogenesis” (“new fat creation”). The body isn’t very fast at doing this, so this arrow is small. If there is a lot of glucose to convert to fat, this process will take hours.

Broadly speaking, this part of the diagram is about storing glucose energy that is coming in from the diet.

Low blood glucose / low insulin

When blood glucose is low, the pancreas secretes glucagon:

image

When the blood glucose is low, the glucagon is a signal to do something to increase the glucose in the blood.

There are only two sources – outside of eating – to raise blood glucose when it is low:

  1. The glycogen that was stored in the liver previously can be converted back to glucose and released into the bloodstream. This is good for the short term, on the order of a few hours, but at some point the liver will run out of glycogen.
  2. If glycogen stores run low, then the body will convert metabolic leftovers into glucose through a process known as “gluconeogenesis” (new glucose creation). This might be temporary until more carbs are eaten, or it might be continuous if there is little glucose coming through food.

When glucose is rare, the body will try to conserve it, so it will burn proportionally more at; that is why the fat arrow is bigger in this part of the diagram.

There is another process – ketosis – that kicks in when there is little glucose coming in from the diet, but that’s a bit beyond the scope of this discussion.

This part of the picture is about running the body on energy that has been previously stored.

The full picture

Here’s the full picture:

image

This diagram shows how a healthy – insulin sensitive – metabolism works. If you eat a meal that has enough carbs to raise your blood glucose, you will be in the top half of the diagram. Between meals – and especially at night – you will be on the bottom portion of the diagram.

Blood glucose and insulin resistance

One of the tests for insulin resistance/type II diabetes is the Oral Glucose Tolerance Test. In the OGTT a person who has fasted overnight drinks a solution with 50 grams of glucose in it and their glucose level is measured every 30 minutes.

image

This chart shows data from an OGTT for three different people.

Because these people have fasted overnight, we would expect them to have used liver glycogen to keep their blood glucose up for most of the night, and that would leave them with some room to store most of the glucose from the test. If that were true, the glucose could be stored quickly without a lot of blood glucose change and a couple of hours later things would be back to normal. And that is what we see on the “normal chart”.

The discussion about the other lines would typically focus on how much higher the blood glucose levels are and how much longer they take to get back to the starting point, but I want to focus on another factor. Note that the other lines start at significantly elevated blood glucose levels. I find this puzzling; let me explain why…

Looking at the patient with moderate type II diabetes, we see that in a span of 90 minutes, they got rid of a lot of blood glucose, from 280 mg/dl to 170 mg/dl, for a difference of 110 mg/dl. Or something like 70 mg/dl in an hour.

But overnight, they can’t get their blood glucose below 130 mg/dl, despite not eating anything and having 8-12 hours in which it could happen. We would expect that the natural use of glucose would drop the blood glucose to normal levels by morning; in fact, it would drop it too much if the liver didn’t add glucose.

Where is the glucose coming that is keeping that from happening?

That is the puzzle.

Looking back at the diagram, there are only two possible sources for the glucose. Maybe it could come from the glycogen stores, but if that were the case we would expect them to be more depleted in the morning and therefore be able to handle the 50 grams of glucose from the test. That doesn’t appear to be the case.

Which points the finger very strongly at gluconeogenesis.

Gluconeogenesis malfunction

In the diagram, I showed gluconeogenesis on the bottom; it is only active when blood glucose was low and glycogen stores are low.

Unfortunately, when somebody becomes insulin resistance, something gets broken with the regulation of gluconeogenesis. Normally it gets turned off when there is insulin in the system, but that gets broken when there is an accumulation of fat in the liver.

The result is a constant supply of glucose into the bloodstream, with the amount related to how much fat has accumulated in the liver.

What does this mean metabolically?

A constant stream of unexpected glucose means that between meals and overnight, we are depleting our glycogen reserves less. That is the big effect we are seeing in the charts; there is less free room in the glycogen store, so more of the glucose that we eat needs to be converted to fat. That not only means more fat in our fat stores, it takes longer to do this conversion, so our insulin levels are elevated for longer. And any time that our insulin levels are elevated is time when we’re on the upper half of the diagram.. So, more fat stored, less time to burn fat.

Not good. But initially the body is still able to deal with the amount of carbohydrate in the diet and the amount being generated and still keep fasting blood glucose levels normal. It does require more insulin all the time – taking the first step towards hyperinsulinemia – and it will also push up HbA1c levels. That’s why HbA1c is a better diagnostic test for insulin resistance for *most* people than fasting blood glucose. Fasting insulin level is probably better still but is not widely used.

As insulin resistance gets worse, there is more glucose created, enough so the glycogen stores are full most of the time.  Any glucose that can’t be burned off immediately goes straight to fat, and the high insulin percentage – the percentage of time in a day when insulin is elevated – goes up. Hyperinsulinemia gets worse, carbs that are eaten go mostly to fat, and fat eaten goes there as well.

Eventually, the pancreas loses the capacity to produce enough insulin and/or the fat and muscle cells get poor enough at pulling glucose out of the bloodstream, the fasting glucose level goes up, and it’s type II diabetes.

The big point here is that a person who is insulin resistant has different metabolism than one who is not; it’s a bit like they are eating a small amount of candy around the clock.

Diabetes is a chronic disease

For a long time, the ADA recommended high-carb, low fat diets as the only diet for type II diabetes. For people who wanted to lose weight – which is true for most type II diabetics – the recommendation would include a small calorie deficit of around 300-500 calories per day.

What is the impact of that diet for somebody who is insulin resistant and has hyperinsulinemia? We still have the glucose created by the liver and we still have a lot of glucose coming in from the diet, so we’re still going to have the hyperglycemia. As long as the hyperglycemia is there, the insulin is there – we’re on the top half of the diagram – it’s hard to burn fat. So, the body has a few options:

  • Turn down our basal metabolic rate to burn fewer calories.
  • Turn down our optional metabolic activity to burn fewer calories.
  • Convert some protein to energy
  • Try to get us to eat more
  • So, we get cold, tired, hungry, and lose lean muscle mass.

    But we still have the hyperglycemia, insulin resistance, and blood glucose issues.

    This is why type II diabetes is generally considered to be a chronic disease. It’s pretty well known that if people can manage to lose weight, their diabetes symptoms get better, but the prescribed diets are generally ineffective at producing a permanent change. I think that the arrow of causation runs the opposite direction; if you can manage to improve your hyperinsulinemia, you will lose weight.

    Dealing with hyperinsulinemia

    The hyperinsulinemia is at the root of the problem. How can we get the insulin down?

    There’s really only one solution; we need to get the carbohydrates down enough so that the excess glucose produced by the liver is no longer enough to cause significant hyperinsulinemia. If that excess glucose becomes metabolically desirable – necessary to run our bodies – than it will no longer be problematic.

    We need to get back to the bottom part of the diagram. There are a couple of different ways of doing this.

    We could just reduce the amount we eat by a lot. Enough so that the glucose we are eating plus the extra from gluconeogenesis is being put to use to run the body and we don’t need any insulin to store it. We could do this by going on a very low calorie diet, something under 800 calories per day. We could get a gastric bypass, which has a similar effect (gastric bypass also appears to have some additional effect because of the physical changes made). Both gastric bypass and very low calorie diets have good clinical evidence for reversing insulin resistance and getting rid of the symptoms of type II diabetes. Some of the fasting protocols will also likely work, though we don’t have the same quality of studies to support them.

    Or we could just try to reduce the amount of carbs we eat by a lot. So low that we would expect to be relying on gluconeogenesis to produce the glucose that we need and low enough that we don’t have a lot of glucose to process. In other words, a keto or zerocarb diet. And keto diets also have good levels of clinical evidence achieving the result we want.

    With other diets, people get less diabetic and perhaps lose some weight, but still end up diabetic at the end. My assumption is that they don’t do as well because those diets don’t deal with hyperinsulinemia *unless* you convert them to very-low-calorie diets.

    Notes

    As noted, this is a really complex area. For basic biochemistry, there are a number of good references out there; I like “Marks Basic Medical Biochemistry”, which can be found in PDF form online.

    For more of the details, see the following links:

    Insulin resistance and gluconeogenesis

  • Insulin regulation of gluconeogenesis
  • Unraveling the Paradox of Selective Insulin Resistance in the Liver: the Brain–Liver Connection
  • Resolving the Paradox of Hepatic Insulin Resistance
  • Keto diets

  • Virta Health Research Page
  • Virta Spreadsheet of low-carb studies
  • Very-low-calorie diets

  • Primary care-led weight management for remission of type 2 diabetes (DiRECT): an open-label, cluster-randomised trial
  • Very Low-Calorie Diet and 6 Months of Weight Stability in Type 2 Diabetes: Pathophysiological Changes in Responders and Nonresponders
  • Calorie restriction for long-term remission of type 2 diabetes
  • Gastric bypass

    Bariatric Surgery A Systematic Review and Meta-analysis

    Hyperglycemia

    Fasting Insulin vs Hemoglobin A1c: Are We Getting It Right?

    Effect of Physiological Hyperinsulinemia on Gluconeogenesis in Nondiabetic Subjects and in Type 2 Diabetic Patients

    Diabetes and diet

    The Dilemma of Weight Loss in Diabetes


    The endurance athlete’s guide to fueling and weight loss part 6: Recommendations

    This post will make considerably more sense if you have read the previous posts

    After five long and sometimes tedious posts, I’m finally going to tell you exactly what your base diet should be and and how to fuel during exercise to achieve your goals.

    Ha.

    I sincerely wish I could do that, but the reality is that everybody is different (genetics, age, sex, metabolic condition) and we all have different goals (win that race/lose weight/have fun), so I’m not able to do that.

    What I do think I can do is talk to you a bit about my philosophy of endurance eating and fueling and how you might apply it to your situation. And then I’m going to turn you loose to experiment/adapt/modify the recommendations to adapt them to your specific situation.

    Philosophy

    Based on the way our biochemistry works, here’s are the principles I advocate:

    • Train in ways to improve fat burning, and therefore improve the ability to use fat as a fuel so that more fat is burned and less glycogen is used, so there is less hunger.

    • Fuel in ways to support glycogen stores and therefore support endurance and performance without getting in the way of fat burning.

    • Eat in ways to support the first two goals and to leave us generally healthy.

    The application of these principles is going to depend on your current weight, fitness state, goals, number of cats you own, etc. In the following sections I’m going to talk about some broad guidelines, but you will need to do experimentation and tuning yourself.

    Train in ways to improve our fat burning

    Doing training to specifically increase fat burning has been a thing for a long time; there was, for example, a big push towards LSD (either Long Steady Distance or Long Slow Distance) training in cycling in the early 2000s. And it worked okay, at least for some people.

    But what it was missing was the dietary and fueling aspect; if you have a lot of glucose in your system during the training, you get improved endurance but you get little improved fat metabolism.

    While thinking about this section, I remembered a mountain training ride I did with a couple of friends back in 2006 or so; it was scheduled for about 115 miles and around 8K of up. I was getting ready, stuffing my jersey pockets with little ziplocs of drink mix and other foods – probably 1500 calories worth – and I noticed one of my friends just standing there. I asked him what he was taking for food, and he pulled out a little bag of trail mix. He said, “I usually don’t eat much on rides, but I’ll have some of this if I get hungry”. Another paradox that the “you have to eat lots of carbs” model doesn’t explain.

    The way that we improve our fat burning is exercise in situations where glucose is scarce. What does “scarce” mean in practice?

    I don’t know.

    Perhaps “scarcer” would be a better word to use, and in fact fits in better as I advocate an incremental approach. Take the amount of carbs that you eat before/during/after, and reduce it by some amount.

    If you generally don’t eat on your workouts, pick one of your workouts – perhaps a longer weekend one – and do it fasted.

    If you are a carbs before/during/after kind of athlete, look at the amount you are eating and cut them down. From a biochemical perspective, targeting the pre-workout carbs – so that you start with lower glycogen stores and steady blood glucose – is probably going to be more impactful, so maybe you cut down or eliminate that snack first. Or maybe you cut down all your carbs by 30%. And then go out and do your workout.

    Generally speaking, longer steady workouts are much better for this than fast short ones. Use whatever definition of “long” that works for you.

    Do that for a few weeks or even a month or two, evaluate how it’s working compared to your goals, and see if you want to make further changes.

    Fuel in ways to support our glycogen stores

    Didn’t I just tell you to reduce your carbs during training, and now I’m telling you to increase them?

    Not quite.

    While there are some athletes who eat full keto (very low carb) diets and use either no or very few carbs during workouts and races, there’s no prize for doing that nor is it a morally superior approach.

    What we are trying to achieve biochemically is to have enough available glucose for our muscles to support us for the exercise so that we can achieve our goals, both from a weight perspective and from a performance perspective.

    If we are doing the “better fat burning” training described in the last section, then the best approach can be described as “the minimal amount of carbs required to keep you from bonking”, as that will give you the most improvement in fat burning. We will deliberately eat in ways that put us close to running out of glycogen. Which is why it is absolutely essential during this training to carry carbs with you, especially if you are starting from a high-carb fueling strategy, because it is very hard to know exactly how close you are to bonking. If you start to get hungry and/or feel your energy dropping quickly, eat some carbs.

    If you are in this purely for the fat burning side, then stick with this strategy. You will increase your fat burn during the ride and reduce the amount you eat during the ride. Both are good.

    If your session is more performance/endurance sensitive – perhaps a goal event or a intense training session – then look at how long/hard it is going to be, make a guess at how many carbs you will burn, and plan a replacement strategy so that you have comfortable reserves at the end. If you are a better fat burner than before you won’t need as much as you did before, but you will likely need some. The pro cyclists who work to be very good fat burners still eat a *lot* of carbs during a hard day of racing.

    Small amounts of carbs on an ongoing basis can be a pain to implement. If you want a simpler approach, consider UCAN’S SuperStarch, which acts like a time-release glucose. and is therefore quite convenient to use. Pricey, however. (note 1) I use it on my longer & harder events – say 4+ hours – but generally don’t on shorter events, where I just have water, even if fasted.

    Recovery nutrition

    Conventional wisdom says that you need to refill your glycogen stores as quickly as possible to take advantage of the brief window where glycogen replacement is increased when exercise is finished. The window does exist, but in most cases, we don’t really need our glycogen stores to be refilled especially soon, and those are extra calories that aren’t required. There’s an interesting study that shows that having the post exercise carbs reduces insulin sensitivity and glucose tolerance the next morning.

    On the other hand, if you want to have something sweet, right after exercise that has depleted your glycogen stores is biochemically the best time to do so, and in particular, it’s a time when fructose likely doesn’t have the same downsides (note 2), so some fruit can be nice. I like peaches.

    My general advice is to tend to not eat targeted recovery food, but if you find that you are ravenously hungry after long workouts, a bit of carbs after exercise can blunt that reaction.

    Eat in ways to support the first two goals and to leave us generally healthy

    Diet is a huge topic that I could write endless posts on. I will try to keep it simple and at least mostly related to the goals that we have been talking about.

    Limit refined carbs and processed food

    Refined sugar (sucrose) is an obvious target, and it’s bad for a lot of reasons – there is lots of glucose that you have to deal with, and lots of fructose that can lead to insulin resistance. Note that sucrose is added to a significant number of processed foods; this is a byproduct of the 1980/1990ss fat phobia, when manufacturers found that reducing fat made food taste awful but you can make it taste less awful if you add a lot of sugar. So, you’ll need to read labels.

    And now for a bit of heresy… I think you should be careful with the amount of fruit you eat. There are many fruit advocates that assert that the sugars in fruit behave differently than refined sugars and therefore fruit is not an issue. It *is* true that:

    1. The sugar is bound up in the flesh of the fruit so that it takes longer to be absorbed than sugar outside of the flesh.
    2. A piece of fruit is much more filling than the equivalent amount of refined sugar.

    But that just means that fruit is a gentler source of sugar, not that you can eat as much as you want. The impact of fruit hasn’t been well-studied in clinical trials, but I did find a study that looked at the relationship of fruit consumption to gestational diabetes, and the effect was significant (note 3).

    If you have a lot of extra weight and/or type II diabetes, I would try to get rid of as much fructose as possible, from all sources.

    And some more heresy… I think that other refined carbs are also important, though not as important as sugars. They lack fructose, but they still have a big load of glucose in them. This is mostly anything made with wheat flour (even whole wheat flour), so bread, pizza, pasta.

    Yeah, I know, I like them all as well. I used to eat a lot of them when I was younger but they don’t agree with me now that I’m on the far side of 50. YMMV.

    Alcohol is also something to limit, for the same reason as fructose.

    And yes, I’ve totally killed the “ride and then celebrate” scene. Sorry to be such a buzzkill.

    Choose an appropriate fat/carb ratio for your situation

    From a general health perspective, the data I’ve seen suggests that if you are healthy in general and insulin sensitive, you will probably do fine on a moderate carb/low fat diet or a low carb/ moderate fat diet, as long as its a whole food diet (note 4). So just choose one that works for you.

    If you are insulin resistant and/or have not being able to reduce your weight easily in the past, I’d recommend trying one of the low-carb approaches as they make more sense for that metabolic state. I usually recommend either Mark Sisson’s Primal, or the Duke University “No sugar No starch” diet.

    Like the changes in fueling, I recommend that you make any dietary changes on an incremental basis.  If you end up going low carb, there is quite a bit of anecdotal data that suggests that endurance athletes are generally happier with diets that have a few more carbs in them (ie not keto), and an interesting study here where none of the participants stuck at a very-low-carb/keto diet but they all did eat a significantly lower-carb diet than they had in the past.

    Case studies

    Because my advice is non-specific, I thought I’d include a few case studies that have specific examples of what people have done.

    One of the posts that started me on this journey was noted cycling coach Joe Friel’s blog post entitled “Aging: My Race Weight”.

    My case study is in my blog post Down 20?

    Chris Froome and other Team Sky cyclists use a low carb diet a their base diet – Froome famously tweeted this picture of a rest day breakfast that was very low carb. They do supplement with carbs based on the event. There’s a bit of insight into their approach here.

    In Closing

    I hope this has been helpful. If you have questions, please send me a comment; I’m planning on a follow-up post to clear up things that weren’t clear.

    Notes

    1. SuperStarch is an interesting story. There is a disease called glycogen storage disease where a person is unable to store glucose as glycogen, and therefore is unable to regulate their blood glucose. The traditional treatment was corn starch every 2 hours, which was hugely impactful. SuperStarch is corn starch that has been modified so that the starch molecules become very long, which means that is slowly digested and therefore results in a slow release of glucose – exactly what is needed for people with this disorder. It also turns out to be quite useful as a carb replacement fuel for athletes. Here’s a paper with links to the clinical studies does with SuperStarch.
    2. Fructose in combination with high blood glucose preferentially metabolizes to fatty acids, which can accumulate in the liver. But if you have depleted glycogen stores, the glucose in the fruit goes straight into those stores and the fructose gets metabolized to more glucose.
    3. The odds ratio between the group that ate the most fruit and the group that ate the least was 4 – those who ate the most fruit were 4 times as likely to get gestational diabetes than those who ate the least. That is really a ridiculously high ratio for a nutritional study; it is uncommon to see anything above 1.5. It was still an observational study, however.
    4. Gardner’s DIETFITS study is a pretty good one. I recommend watching his video here.

    The endurance athlete’s guide to fueling and weight loss part 5: Hunger etc..

    Please read the previous posts if you haven’t seen them before…

    We are moving closer to the post where I hope to give useful advice on the different tactics you might use to improve fueling or lose some weight. Or perhaps both.

    This was going to be a short post as I was having trouble coming up with a good way to talk about hunger, but I came across some new (to me) information that I hope will be informative.

    Hunger

    Hunger lies at the intersection of energy balance, brain function, psychology, and group dynamics. Oh, and evolutionary biology. That makes it complex and hard to understand, and therefore not very amenable to easy explanations or simplification. It’s much more complex than – for example – how blood glucose is controlled. I’m therefore going to have to simplify quite a lot, and there will be a number of areas where it’s just not clear (to me) what is going on. That said, let’s get started.

    The evolutionary purpose of hunger is to drive us to eat in ways that maintain our energy stores – and in particular, our fat stores – at a certain level. Or perhaps within a certain range. What factors could set the low and high limits of that range? (note 1).

    Let’s start at the lower end – what drives the lower end of the fat storage range?

  • If we have too little stored energy, we won’t be able to survive when food becomes scarce.
  • If we are female, we need extra stored energy to be able to build and feed a child.
  • And at the upper range?

  • If we have too much stored energy, we may not be able to move around effectively, which could compromise our survival.
  • There may also be impact based upon climate, but I’m going to ignore that for this discussion.

    Another way to describe the range is “enough fat, but not too much fat”. Where “enough” and “too much” have definitions that are a bit squishy. But you get the idea…

    The regulation of hunger – and therefore the regulation of energy intake – is driven by two hormones, leptin and ghrelin. To oversimplify things:

    Leptin is produced by fat cells, and serves to reduce hunger. Generally speaking, the larger the fat storage, the higher the leptin levels will be. You can think of leptin levels like the gas gauge on a car; if your fat tank is empty, leptin reads low, if you fat tank is full, leptin reads high.

    Ghrelin is produced by the stomach, and serves to enhance hunger. It’s a shorter term signal.

    Based on a simple understanding of how the hormones work, we would expect that Ghrelin levels would be proportional to how long it was since we ate; the longer we went without food, the more hungry we would be.

    Here’s a graph of Ghrelin values over a typical day:

    (note 2)

    The solid line is the average while the dotted lines show the upper and lower range.

    That’s not what I expected. Ghrelin levels are lowest right when we get up, which is when we have gone the longest without eating and would therefore expect them to be highest. It turns out that ghrelin levels have a few somewhat interesting features:

  • They are adaptive based upon when we usually eat and our circadian rhythms.
  • They increase when we start to eat. This is familiar to most of us; not being really hungry but finding out that as we smell dinner or start eating, we are suddenly hungry.
  • There’s another strange feature of ghrelin related to fasting. Here’s a study (note 3) that looked at ghrelin levels over an 84 hour fast:

    image

    That’s just weird. The mean ghrelin levels decrease from day do day, which means you are actually quite a bit less hungry on day three of fast than you are in day one. While weird, this is pretty well established by research.

    Also note that there seems to be a greater reduction for women, for reasons that are not well understood.

    Why our bodies behave this way is not really known. The best theory I know is one from an evolutionary standpoint; while it is good to be hungry if food is available, it can quickly become counter-productive if food is scarce.

    Moving onto leptin, what do leptin levels look like? (note 4):

    image

    That is what we generally expect – at least there seems to be a decent linear relationship between BMI and leptin levels. It’s a bit messy, probably because BMI does not correlate perfectly to fat mass, and likely because of individual variations as well. The differences between male and female leptin levels are asserted to be caused by a) women having more fat mass at a given BMI and b) women having more of the kind of fat cells that produce more leptin than men, though I don’t think the question is truly settled.

    Disfunction

    Leptin is supposed to inhibit significant weight gain; if you gain excess fat, your leptin levels rise, your hunger drops, and you lose fat mass until your leptin levels drop. And that seems to work for some people, especially those who are young, choose their parents well, and male. But it’s pretty obvious it does not work well in a lot of cases.

    Is there anything known about the disfunction? Well, a bit…

    Leptin and ghrelin levels based on types of food

    I found a very nice experiment (note 5) that looks into leptin and ghrelin response based on different kinds of food. Take a group of people, have them fast overnight, and then give them one of three drinks:

  • 500 calories with 80%/10%/10% from carbs, fat, and protein
  • 500 calories with 10%/80%/10% from carbs, fat, and protein
  • 500 calories with 10%/10%/80% from carbs, fat, and protein
  • In other words, a carb-heavy (glucose-heavy), fat-heavy, and protein-heavy drink (note 6). This is done in what is called a “crossover” study, which means that each subject had all three drinks on different days.

    You sample their blood before they have the drink, and then every 30 minutes afterwards, and measure a bunch of different things. Based on how ghrelin works, I would expect that eating would suppress the ghrelin levels and then over time, they would rebound to their previous levels.

    What happens?

    image


    All three produce a significant suppression of ghrelin production, but carbohydrate produces the biggest reduction. Interestingly, however, after about two hours the carbohydrate ghrelin level goes shooting up and after 3 hours it is higher than the fat or protein curves and soon after becomes higher than the initial ghrelin level.

    Or, to put this another way, five hours after eating 500 calories of mostly glucose we would be *more hungry* than we were at the start.

    The authors write, “Our finding of a rebound of total and especially acyl-ghrelin above baseline after high-carbohydrate meals could provide some physiological basis for claims made by low-carbohydrate diet advocates that ingesting carbohydrates prompts an early hunger rebound”.

    Indeed.

    They did measure subjective appetite which showed no effect, though unfortunately they had technical difficulties with the appetite reporting system and that data was therefore not published.

    I’d also like to note that there are many experiments that measure satiety (the inverse of hunger) and show that carbohydrates lead to more satiety than fats or protein. And they do, if you only measure them for 2-3 hours.

    The experiment also measured blood glucose over time:

    image

    If I eyeball the two charts, it looks like ghrelin production starts to go up steeply about the time blood glucose drops quickly at 140 minutes, and is highest when the blood glucose is the lowest. The pattern here matches what is known as either “reactive hypoglycemia” or “postprandial hypoglycemia” – basically the blood glucose drops below initial levels a few hours after eating.

    It’s important to note that the drinks were dominated by a specific macro and drinks with mixed macros may show unexpected results. Though 500 calories is not really that much and these were consumed in a fasted state, and as we know that is the time when the body is best able to handle a lot of glucose.

    You can find the leptin chart in the paper if you’d like to see it; there were small drops over time but nothing very striking.

    Fructose vs Glucose

    Is there a difference between fructose and glucose? Let’s look at another experiment (note 7).

    In this experiment, we take 12 normal-weight women and feed them three meals containing 55%, 30%, and 15% of carbohydrate/fat/protein and take blood samples every 30-60 minutes.

    Of the 55% of the calories that come from carbs, 30% either comes from a fructose-sweetened or glucose-sweetened beverage.  Take a normal meal pattern and make the carbs either fructose heavy or glucose heavy. And sample their blood periodically:

    image

    Wow. Lunch and dinner show large spikes in ghrelin for both drinks, but the late-night spike of the fructose drink is much higher. Also notice the difference in levels at 8am the next day; the level of ghrelin in those who had glucose is quite low, but it’s pretty high for those who had fructose.

    Fructose gives us bigger positive ghrelin peak than glucose.

    They also measured blood glucose levels:

    image

    Based on what we know about glucose and fructose metabolism, that is what we would expect; because the fructose is processed in the liver, there is much less glucose. We would expect that the liver processes the fructose to triglycerides. Is there data to support that?

    image

    Yep. Vastly higher triglyceride levels show the fructose being converted to fat and released into the bloodstream, and those levels persist through the night.

    They also measured leptin levels:

    image

    Leptin levels rose much less for the high-fructose meal, which means there was less inhibition of appetite.

    Overall, fructose led to a greater increase in ghrelin (higher appetite) and a lesser increase in leptin (less appetite suppression).

    So, carbohydrates in general aren’t great, and fructose is worse.

    The best theory I’ve seen around why fructose behaves so differently is that significant fructose supplies were rare in historical times, and therefore it was advantageous for humans to eat as much as possible when they found them. That sounds reasonable, though like many studies in evolutionary biology they are hard to support.

    Leptin resistance

    The mystery of why leptin isn’t behaving as we would expect – why people still eat a lot even with high leptin levels – has been labeled “leptin resistance”, by analogy with insulin resistance; the idea is that for some reason the brain is not sensitive to the levels of leptin.

    Whether there is actual resistance or whether there are other factors that are overpowering the leptin signal is not clear.

    There are a number of theories round what is actually happening. Among them are:

  • There is a defect in transporting leptin from the bloodstream into brain cells across the blood/brain barrier.
  • The cells within the brain become less sensitive to leptin.
  • Dietary fructose leading to elevated triglycerides reducing leptin transport across the blood/brain barrier.
  • Here’s two papers if you want more information (note 8) (note 9).

    Dopamine

    I’m including this section for completeness. There is some research on how dopamine is affected by sugar ingestion, and while I think there something going on there that partially explains why sugar is addictive – at least for some people – I’m not confident enough in my understanding and the quality of the research to have much to offer.

    I do offer a few papers:

    Hunger Summary

    The main points from the preceding section on hunger:

    • Carbs – and especially fructose – seem to interfere with the hunger control system.
    • Hunger is not directly related to how long it’s been since you ate; it has a daily rhythm and decreases when fasting.

    Energy balance and weight loss

    If you have read official guidelines and advice about weight loss, you can generally boil them down to one bit of advice:

    Eat less and move more

    This is often summed up as the “Calories in / Calories out” (CICO) model; eat less means fewer calories in, move more means more calories out, and the result will be weight loss.

    It is also typical to see appeals toward the Laws of Thermodynamics. The more rabid adherents to the model treat it as if they have discovered one of the deep secrets of the universe.

    If you have read the earlier posts and have learned anything about biochemistry, I’m sincerely hoping that you suspect that the reality might just be a *tiny* bit more complicated than the simple world of “eat less and move more”. Especially since that advice fails for a large number of people, at least for the long term.

    There is truth to the CICO model in one sense, if you are losing weight you are burning more calories than you are taking in. And vice versa. But that’s the result, not the driver; the driver is the biochemistry at work.

    The key to understand how things really work – and why CICO isn’t very useful in many cases – is related to how the body responds to a reduction in food intake. The body essentially has three options to balance things out:

    1. It can burn stored fat.
    2. It can tear down muscles (ie “lean mass”) and burn that.
    3. It can reduce its energy use.

      We are hoping that it would do #1 – after all, the whole point of the fat storage system is to provide an energy reserve when food is scarce. But remembering the earlier posts, there are a couple of things that can get in the way of that. First off, we need to be good at burning fat in general. And second, we need to be in a hormonal state where fat burning is possible.

      If either of those aren’t true – or are true only to a limited extent – then we are stuck with tearing down muscle and reducing energy use. And, in fact, that is what we see in a lot of diet studies; people will lose lean mass – sometimes a significant amount – and people report being cold, tired, and hungry all the time.

      And they don’t really lose all that much weight.

      If we can get rid of the conditions that are blocking fat metabolism – and, since we are athletes, up the amount of fat we burn when exercising – then the body should naturally start burning more stored fat, and we should lose weight. Or, to put it another way, we are going to focus on the fat burning side of the house.

      This post is already quite long so I’ve tried to limit the detail in this section; if you want more I highly recommend Peter Attia’s post on fat flux.

      Summary

      There is a lot more that I could write about WRT hunger and energy balance, but I think this is enough for now.

      Our strategy is going to make dietary modifications to reduce hunger and improve our ability to use fat to generate energy while exercising, with a goal to lose weight/improve our ability to perform in long events.

      Which takes us to the tactics portion of the series. What do I think you should actually *do* to implement these strategies, so that you can – with any luck – see the benefits that I’m talking about.

      That will be post #6. When I get that done, I’m planning on doing at least one post to cover any questions.

      Post #6: Recommendations

      Notes:

      1. I’ve tried to base this section on what I’ve learned about evolutionary pressure, fat stores, and hunger.
      2. From Jason Fung’s excellent discussion on hunger and fasting here.
      3. Fasting unmasks a strong inverse association between ghrelin and cortisol in serum: studies in obese and normal-weight subjects
      4. Mechanisms behind gender differences in circulating leptin levels. This result is widely replicated in other studies.
      5. Acyl and Total Ghrelin Are Suppressed Strongly by Ingested Proteins, Weakly by Lipids, and Biphasically by Carbohydrates
      6. The beverages were mostly composed of a glucose beverage, whey protein/nonfat milk, and heavy whipping cream for the carb/protein/fat drinks.
      7. Dietary Fructose Reduces Circulating Insulin and Leptin, Attenuates Postprandial Suppression of Ghrelin, and Increases Triglycerides in Women
      8. Leptin resistance: a prediposing factor for diet-induced obesity
      9. Mechanisms of Leptin Action and Leptin Resistance
      10. MarksDailyApple, by Mark Sisson’s. Mark is an advocate for a way of eating named “Primal”.

      The endurance athlete’s guide to fueling and weight loss part 4: Better fat burning in actual athletes

      Please read the introduction and earlier posts if you haven’t…

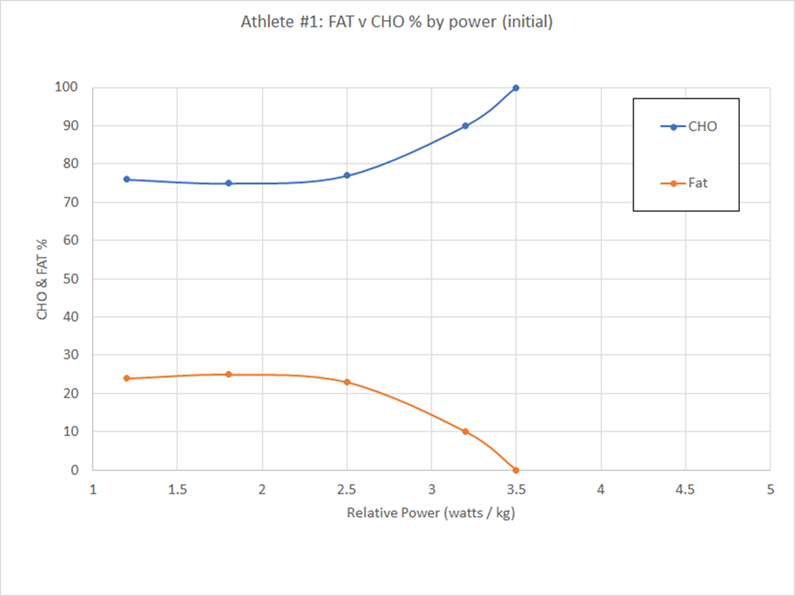
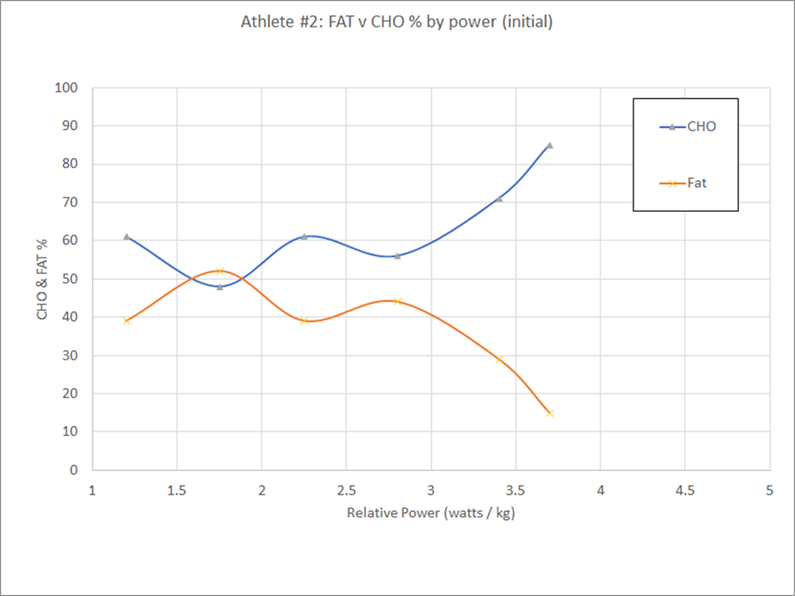
      In the last post, I finished by asking what factor or factor might cause the difference between these two athletes:

      image_thumb2

      image_thumb5

      The differences might be genetic, differences in diet, or differences in training. Or maybe something else. What do you think is at play?

      We don’t know all the factors, but it turns out that this athlete does not have a sweet tooth, so he eats closer to the recommended cyclist diet; lots of carbs, but not a ton of sugar. At least in his base diet; I don’t know what he eats before/during/after training. And he’s better at burning fat.

      Hmm. It’s almost as if there might be a dietary effect here, that the availability of carbohydrate in the diet and on the bike might have an effect on fat burning ability. How could we test that?

      Well, let’s put two cyclists – how about these two cyclists? – in a situation where there is much less carbohydrate available, let them train for 10 weeks, remeasure their VO2Max, and see what changes. Since we want to maximize the effect, we’ll put them on a very low carb “keto” diet, which is something like 30 grams of carbs per day.

      What happens?

      Well, athlete #1 is not happy on the keto diet, and that’s really no surprise; he’s not good at producing energy from fat *at all*. If you take away his carbs he will feel horrible on the bike. He ends up making the following adjustments from has previous diet:

    1. He minimizes all sources of sugar
    2. He limits bread, rice, pasta, and potatoes to once or twice a week.
    3. He reduces the food he eats on the bike to an occasional banana plus water
    4. Not really a low-carb diet, but certainly a *lower than before carb* diet.

      Ten weeks of training go by, he retakes the test, and we generate a new graph (previous results are dotted):

      image

      This athlete is now a significantly better fat burner; rather than hitting only 25% of calories from fat, he’s averaging 40% or so across most of his range. His beta oxidation system is better.

      Athlete 2 started with the same very-low-carb diet, and he didn’t stick to it strictly either, but he did mostly get rid of grains and fruit from his diet, and he ended up lower-carb than athlete 1.

      10 weeks go by, and we get this:

      image 

      Yowsa! He nearly doubled the amount of energy he got from fat in parts of his range, and averages over 70% for most of the range. There is also a significant shift to the right, and he produces a higher maximum relative power. That’s great, the low carb diet made him much more powerful!

      Not so fast. Remember that this is *relative power*, and we know that he lost some weight as part of his 10 weeks training, so most of the improvement is likely from the reduction in weight. Though the training may also have helped.

      What did we see across these two athletes?

      First – and most importantly – we saw that a dietary switch made significant changes in the fat metabolism ability for both athletes. This really isn’t very surprising knowing what we know about the underlying biochemistry, but it does show very clearly that beta oxidation capability can be trained.

      Second, we saw a correlation between the amount of carbohydrate in the diet and the overall ability to metabolize fat.

      I do want to add a few caveats. The first is that two cyclists is a very low sample size, and the second is that we can’t tell the difference between changes due to base diet and changes due to food before/during/after. And there may be a genetic component at play here.

      Returning to my RAMROD example from the last post, let’s add in two more lines, corresponding to getting 50% of calories from carbs and supplementing 200 cal/hour (yellow) and getting 25% from carbs and supplementing 25 cal/hour (blue). These lines are closer to the “after” graphs of the two cyclists.

      image

      If I can get up to 50% fat utilization and supplement at 200 calories per hour, I should be able to go 12 hours without running out of glycogen. And if I can get up to 75% from fat, I can supplement at only 25 calories per hour and still easily make it to 12 hours.  I can almost get to 12 hours without eating anything at all…

      It may be better than that. Remembering back to the first post where we talked about triglycerides, and how those are composed of a glycerol backbone with three fatty acids attached to it. If we are burning lots of fatty acids in beta oxidation, that means the fat cells are breaking apart triglycerides, and that means we have a lot of extra glycerol around.

      Since the body doesn’t want to waste energy, it will try to use the glycerol for something useful, and it can turn it into glucose through gluconeogenesis. That means if we are burning a lot of fat, we will get some glucose out of it to support the glycolysis side. And no, I don’t know how much “some” turns out to be, this is hard to study.

      Some more data

      Is there more data out there that would be interesting?

      Jeff Volek and Stephen Phinney have done a number of studies looking at low-carb/keto diets and athletes (note 1), and here’s one that I think is relevant to this topic:

      Metabolic characteristics of keto-adapted ultra-endurance runners

      One of the problems with dietary studies is that the studies are expensive and time is limited, so it’s very hard to do studies where you change an athlete’s diet and check to see how it affects her for the next 12 months. That is why many of the studies around keto diets and athletes are extremely short; less than 3 weeks. Knowing what we know about how long it takes to achieve training gains in general, it’s pretty clear that 3 weeks is on the short side to see adaptations, so I don’t think most of those studies are very good.

      In this study, Volek and Phinney instead looked at two groups of elite ultra-endurance runners, 10 who followed a high-carb diet, and 10 who followed a low-carb diet. Since each group was on their habitual diet, it’s a pretty good bet they were adapted to it pretty well. I will note at the outset that this is an observational study and therefore there is the possibility that the runners who chose low-carb are genetically better at burning fat than the high-carb ones.

      From the hypothesis about trainability, what difference would we expect to see in fat burning rates between the two groups? Here’s the first graph:

      image

      The graph shows the peak fat oxidation during a 3-hour run for all of the athletes. Every low carb athlete is significantly better at burning fat than even the best fat-burning high carb athletes. If we look at the averages (circles to right), the average in the low carb group was 2.3 times higher than the high-carb group.

      I’d also like to note that the average for the low carb group was 1.54 grams/minute. That would be 92.4 grams/hour, or a whopping 92.4 * 9 = 832 calories / hour from fat burning alone.

      Where did that peak fat oxidation occur? Here’s another graph:

      image

      Here we are looking at the relative intensity of that fat peak for each runner; the HC group peak was at 54.9% of VO2max, and the LC group peak was at 70.3%. Not only are the low carb athletes burning more fat, they are hitting their peak at a higher intensity.

      It is pretty clear that the low carb athletes are burning vastly more fat during a long run than the high carb athletes. And this study was with elite athletes doing ultra-distance events, which means even the high-carb athletes are likely to be decent fat burners.

      There are some other interesting graphs in the paper that I recommend looking at (note 2), and we may come back to it later.

      Summary

      We found out that there seems to be a strong training effect and we can expect to improve the rate at which we burn fat through training. We also learned that if we can do that, it can make fueling more straightforward on long rides; we may need to still supplement, but likely not as much.

      In the next post, we’re going to take a little excursion into talking about weight loss and hunger.

      Part 5: Hunger etc.

      Notes:

      1. Phinney and Volek have written a couple of books that cover this same subject area: “The Art and Science of Low Carbohydrate Living” and “The Art and Science of Low Carbohydrate Performance”.
      2. Section 3.2 talks about submaximal substrate utilization, and features two charts that show the average oxidation rates (in grams/minute) for both fats and carbohydrates. The low carb group was very steady across the whole 180 minutes of the run; both fat and carbohydrate utilization is nearly a flat line. The high carb group saw a drop in carbohydrate and increase in fat over time; they also saw a slight reduction from 13.2 cal/minute at the start of the run to 12.0 cal/minute at the end.


      The endurance athlete’s guide to fueling and weight loss part 2: Energy Systems

      Please read the introduction and earlier posts before reading this one.

      In our last episode, we learned about how fat and carbohydrate get into our systems and the fundamental asymmetry between those two systems.

      In this episode, we will look at how fat and glucose are used for energy. My focus is going to be on muscles since these posts are for athletes; there are similar concepts that apply to other tissues but they are beyond the scope of this discussion (see note 1)

      I’m going to have to dive into some biochemistry to create a framework for further discussion; I have tried to simplify it as much as possible, and the post is relatively short.

      This is a summary of the overall processes at work for aerobic energy production; there are others that are at work for non-aerobic production.

      Each of the boxes is a complex series of chemical steps (note 2)

      image

      We’ll start at the bottom and work our way up.

      Citric acid cycle

      Our goal is to take fat and carbohydrates and create ATP, which is what powers our muscles. At the center of the diagram is a compound named acetyl coenzyme A, abbreviated as “Acetyl CoA”. You can think of Acetyl CoA as the common energy compound produced from either glucose or fatty acids. That’s not absolutely correct, but it’s correct enough.

      The Acetyl CoA feeds into the citric acid cycle (sometimes known as “Kreb’s Cycle” after one of the discoverers). If you want to see the details, here’s a link:

      Image result for don't press this button image

      You pressed it, didn’t you?

      Biochemistry is just ridiculously complex.

      All of this takes place inside of each of most of our cells. You probably studied cells when you were in biology class, and the diagrams looked something like this:

      Image result for simple cell nucleus mitochondria

      Specifically, the citric acid cycle happens within the mitochondria, which you can see are those oval-shaped structures within the cell. I generally think of cells as being these little spheres or flat discs, and some are, but muscle cells are a bit different:

      Image result for muscle cell nucleus mitochondria

      Not at all like a globule or a flat disc; I especially like the nucleus stuck on the side as an afterthought.

      Muscle cells need a lot of energy so they have tons of Mitochondria. Thousands of them.

      And how are we going to get all the Acetyl CoA that we need to drive those muscles?

      Glycolysis and Beta Oxidation

      Glycolysis is the the process that converts Glucose to Acetyl CoA. Beta oxidation is the process that convert fatty acids to Acetyl CoA. Both of these processes happen in the mitochondria.

      There is a very important point to be made about glycolysis and beta oxidation. Even though they both occur in the mitochondria and even though they both feed into the citric acid cycle, they use different chemical pathways and therefore use different machinery.

      The citric acid cycle, glycolysis, and beta oxidation can all be trained. Not only can the body build more mitochondria, it can improve the rate at which each bit of machinery in the mitochondria works. That is one of the adaptations that makes us better at aerobic exercise.

      But the body only makes improvement to the parts of the machinery that are being stressed, so if it’s glycolysis that is being stressed, improvements will be made in the glucose metabolism, and similarly if beta oxidation is stressed, improvements will show up in fat metabolism.

      This point is going to be fundamental to our next discussion, so I’ll state it again in a different way – you can be an athlete with a very powerful glycolysis pathway and a crappy beta oxidation pathway. And vice versa.

      Another interesting outcome is that to achieve higher performance, you need to improve either glycolysis or beta oxidation *and* the citric acid cycle. You can do a bunch of work to improve your beta oxidation and you’ll burn more fat and fewer carbs, but you won’t see higher performance if the citric acid cycle is unchanged (note 3).

      Summary

      This was a short post and I’m not sure I really need a summary, but the short one is that both fat burning and glucose burning have separate chemical reactions (glycolysis and beta oxidation) that feed into a shared set of chemical reactions (the citric acid cycle) that ultimately give the energy to drive the muscles.

      That’s all for this post. The next post will take this post and apply it in real-world situations.

      Part 2.5: More on muscles and energy systems

      Notes

    5. That would take us into ketone bodies and their usage in different tissues.
    6. Like, ridiculously complex. In glycolysis, to get from glucose to pyruvate – which is fed into the citric acid cycle – takes a series of 10 different chemical transformations. Beta oxidation goes through 5 steps but repeats them for every two carbon atoms on the fatty acid, and it’s more complex for unsaturated fatty acids. The citric acid cycle has 9 steps.
    7. This depends a bit on what you mean by “performance” and it ties into fueling, which will come up very soon in a future post.

    8. The endurance athlete’s guide to fueling and weight loss introduction

      Author’s note: I write these posts to further my own understanding and to answer some questions I’ve been asked. I’m not doing it to make money, but since I’ve been asked, if you want to buy me a coffee or an adult beverage, you can do that here.

      ****

      I’ve always been interested in nutrition for athletes, and as a serious recreational cyclist – whatever that means – I’ve played around with a number of different approaches. And I’ve read a lot of books that explain how to do the “standard athlete diet”, and done my best to follow them.

      But there were a couple of things that had me confused…

      The first was my inability to come up with a nutrition strategy that worked for me on very long and hard rides. Invariably, if I got beyond about 7 hours, I felt sick and weak, and sometimes it happened earlier.

      The second was just an observation at first; there were people I rode with who rode a *lot* more than I did but still carried a significant amount of extra weight – 30 or even 50 pounds. I knew from talking with them that they ate like I did, and they were already riding in excess of 5000 miles a year, so more exercise couldn’t be the answer. It was quite the puzzle, but it took getting into my 50s and finding that my weight was no longer easily controlled by cycling and that I was having energy issues in the afternoon to compel me to investigate a bit further.

      That led to a period of two years where I learned a lot more about physiology and taught myself enough biochemistry to be moderately dangerous. And changed both my diet and fueling strategy significantly.

      And, incidentally, I lost around 15 pounds. I was 178 pounds to start, and at 6’1”, that’s reasonably light, but at 163 pounds, I’m now “cycling light”, and that’s made a big difference on the rides I do.

      This series is my attempt to put down the important things that I’ve learned in a coherent manner so that others can benefit from it, and I can get clear in my head what I think I know.

      I’ll warn you at the outset; I’m going to be talking about biochemistry because that understanding is pretty critical when we get to talking about strategies and tactics. I have tried to make it “Just enough biochemistry”.

      The following is a list of the various posts. I really recommend reading them in order as the later posts build on the earlier posts.

      1. Part 1: Macronutrient intake and storage
      2. Part 2: Energy systems
      3. Part 2.5: More on muscles and energy systems
      4. Part 3: Carbohydrate and fat use in actual athletes…
      5. Part 4: Better fat burning in actual athletes…
      6. Part 5: Hunger etc…
      7. Part 6: Recommendations

      The endurance athlete’s guide to fueling and weight loss part 1: macronutrient intake and storage

      If you haven’t already, I recommend reading the introduction

      We’re going to start by going into the biochemistry of how the various macronutrients – fat, protein, and carbohydrate – make it into our bloodstream and how they are stored.

      I’ve simplified the biochemistry as much as practical. If you want more details, you can start with the chapters about fat and carbohydrate metabolism in Marks Medical Biochemistry, but I’ll warn you that biochemistry is annoyingly complex.

      Digestion and Storage

      Fat

      When we eat fat, we are eating triglycerides, which look like this:

      Image result for triglyceride

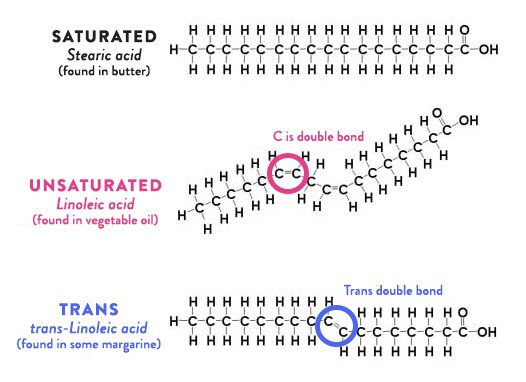
      Triglycerides are simply 3 fatty acids hooked to a glycerol backbone. The fatty acids are just chains of carbons with hydrogens attached to them and then what’s called a hydroxyl group (pink in the image) at one end. Discussion of fats is imprecise; sometimes we talk about “fats”, sometimes “fatty acids”, and sometimes “triglycerides”. You can treat all those as equivalent for this discussion.

      The fatty acids shown here are saturated fatty acids; the differences are mostly immaterial for the purposes of this series, so I’m going to ignore them.

      After digestion, fatty acids end up in the bloodstream, our adipose (fat) tissue pulls them in, and stores the fatty acids away. Very simple and the system works quite well.

      The amount of energy you can store in fat cells is close to unlimited. Even only 10 pounds of fat stores about 35,000 calories, which is a ton of energy; that’s about 1000 miles of riding for the kinds of rides that I do.

      Protein

      The protein in the food we eat is broken apart into individual amino acids, absorbed into the bloodstream, and… Well, at that point it gets a little weird.

      There is no centralized storage for protein in the body. There is a what is called the “amino acid pool” in each of the cells, but generally speaking, if we eat more protein than is immediately usable by the cells, the rest is excess. Most of the excess amino acids can be converted to glucose through a process known as gluconeogenesis, so some of the excess energy becomes blood glucose, but if there is too much, it is just thrown away.

      Now, if you look at it another way, you can view muscles as a centralized storage for protein. There is something known as “protein sparing” where the body generally tries not to tear apart muscles to get energy, but if the need is great, the body will tear down protein, convert it to glucose, and burn it. If you’ve seen the pro cyclist upper body muscles, you can see this effect in action.

      Carbohydrate

      Carbohydrates are much more complex; unlike the fat system, where all fatty acids are treated equally, the different sugars are treated quite differently. I’m going to talk about how the various sugars get into the bloodstream and what form they take before I talk about storage.

      Glucose

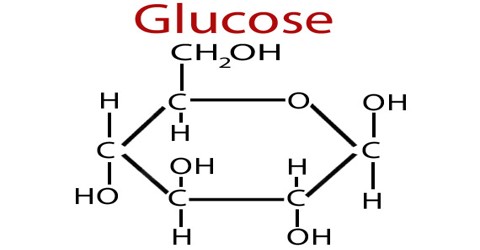
      Image result for glucose

      Glucose is one of the common currencies for energy in the body. When you eat glucose, it is absorbed into the bloodstream.

      Starch/Maltodextrin/Dextrose

      These are sometimes known as “glucose polymers”, which is a fancy way of saying “chains of glucose”. The chains are broken apart into glucose in the digestive system before they are absorbed and that generally happens fairly fast.

      You can treat dextrose, maltodextrin, and most starches as if they were glucose from a nutritional perspective. There are a few exceptions; there is “resistant starch”, which doesn’t get digested easily and can be converted to fat in the digestive system by bacteria, and a cool product known as SuperStarch that I’ll talk about in a later post.

      Sucrose/Fructose

      Sucrose is a disaccharide, which means it’s a compound of one molecule of glucose and one of fructose. You can treat the glucose part just like any other glucose molecule.

      The fructose part is more complex. Some fructose may get digested into fat in the digestive system, but the fructose that makes it into the bloodstream cannot be used directly by the cells of the body. Rather than waste that energy, the liver takes the fructose molecules and does a bit of processing on them. If glucose is rare (blood glucose is not high), the resulting compounds will become glucose, and if glucose is common, it will convert those compounds into fatty acids, which is released (if you are lucky) or accumulates (if you are not lucky). More on that later.

      High fructose corn syrup is about 55% fructose and 45% glucose, so it’s pretty close to the same mixture as sucrose and from a dietary perspective, you can treat it the same.

      I should also note that some people have varying degrees of fructose intolerance; it can cause what is politely known as “digestive issues”. If I eat any fructose during exercise I will get immediate stomach issues. I mention this because it took me a long time to figure out.

      Lactose

      Lactose (milk sugar) is another disaccharide, in this case a combination of glucose and galactose. The glucose is like any other glucose, the galactose is like fructose in that it can only be handled by the liver.

      Alcohol

      What we call ‘alcohol’ – ethanol – is lumped together with other carbohydrates even though it is not a sugar. Ethanol can only be metabolized through the liver, and like fructose and galactose, it might end up as glucose or it might end up as fatty acids.

      Blood glucose levels and glucose storage

      Much of the physiology we’ll talk about is driven by blood glucose levels. There are two big things to know:

      Thing 1: There is a narrow range for healthy blood sugar levels

      When blood sugar is not in a narrow range, bad things happen. Normal fasting blood glucose levels are around 80 mg/dL (milligrams per deciliter). If you get below 50 or so, you can end up in a coma, which is bad; that is what happens to type I diabetics if they get too much insulin. If you get above about 215, you need to seek medical attention, and above 300 is an immediate risk. And moderately high levels on an ongoing mean that you have type II diabetes.

      Thing 2: The quantity of glucose in the bloodstream is small

      How much glucose is in the blood? Knowing that an average fasting blood glucose is 80 mg/DL and  that the average adult has about 5 liters of blood in their bloodstream – 50 dL – we can do some very simple math:

      glucose content of blood = 80 mg/dL * 50 dL = 4500 mg = 4 grams

      How much is that? About this much:

      Image result for sugar cube.

      One small sugar cube. There is a *tiny* amount of glucose in the bloodstream.

      The small range of normal blood glucose levels plus the small amount of glucose in the blood means that even a modest amount of glucose coming in from the outside could have a huge effect on blood glucose levels; a mere 4 grams of glucose would double the blood glucose level if there were no mechanism to deal with the extra glucose. The body therefore devotes significant amounts of machinery to try to keep blood glucose constant.

      Blood glucose level is regulated by the pancreas. As the cells of the body pull glucose out of the blood, the level drops, and the pancreas releases the hormone glucagon. The glucagon signals the liver to release some of its stored glucose into the blood stream to bring the blood level back to normal. The liver can store about 100 grams (400 calories) of glucose, which it stores as glycogen. If the liver glycogen stores are chronically low – if you aren’t eating many carbs on an ongoing basis – the liver can make glucose from other compounds – like lactate, the glycerol from triglycerides, and some amino acids from protein – using process known as gluconeogenesis – and it can also switch some tissues to use ketones rather than glucose to reduce the required amount. If you aren’t eating anything – if you are fasting or starving – your body can still make the carbs you need.

      Low blood sugar is the less interesting case, because the body is (generally) quite capable of dealing with it. The more problematic part is high blood glucose…

      If you eat something with carbs, as they are digested you will end up with glucose coming into the bloodstream. The pancreas detects the raised blood sugar, and starts releasing insulin, which is a signal to other tissues to do their best to pull glucose out of the blood. There are 3 main effects from the elevated insulin:

      First, the burning of fat is minimized so that as much glucose can be burned as quickly as possible. The more glucose being pulled out of the blood, the less the blood glucose level will rise.

    9. Second, the liver will start pulling glucose in and storing it as glycogen, as long as it has space. The muscles will also start pulling glucose in if they have space to store it, and the muscles can store around 400 grams (1600) calories. Conversion from glucose to glycogen is quick and there are a lot of liver and muscle cells, so if glycogen stores aren’t full, the glucose will quickly be pulled into those cells, and blood sugar won’t get very elevated. But compared to fat, the storage is quite limited, and it’s very rare that glycogen stores are low; muscle glycogen is only burned through activity, so it’s generally only the liver storage that is in play, so there’s often just not much space to store glycogen. 
    10. The third effect happens if the liver and muscle glycogen stores are full. There is no easy place to store the glucose but it’s still coming in from the digestive system, so the blood glucose level goes higher and the pancreas releases more insulin. There is only one place for this excess glucose to go, and that is fat, so the liver and the fat tissue pulls in glucose and converts it to fat. This is slower than the conversion to glycogen, so the elevated blood sugar and insulin levels persist for a few hours.

      Because that it is highly important to keep blood glucose low and limited storage space, there is a fundamental asymmetry between the fat and carbohydrate storage systems, and that asymmetry drives a lot of the physiological response.

      The big upshot of this – the reason I’ve talked so much about the underlying biochemistry – is that the two big effects of lots of carbs are a) converting excess carbs into fat and b) turning off fat burning while that process is happening. If you’ve ever “carb loaded”, you deliberately put yourself into this situation. It *does* push a little more glucose into your glycogen reserves, but most of the excess carbs just go straight to fat. Will they stay as fat? Well, that question will be covered in a future post…

      Insulin Resistance and type II diabetes

      It seems like an appropriate point to talk about what is different for people who have insulin resistance or type II diabetes.

      The previous explanation is how it works if you are metabolically healthy – if you don’t have insulin resistance / type II diabetes.  Here’s a graph:

      The normal person sees just a small spike of glucose and it quickly returns to normal, the pre-diabetic sees a spike and then a drop afterwards (this is likely not true for all pre-diabetics), and the type II diabetic starts with an elevated glucose level and a meal just spikes it way up.

      Part of what we are seeing is that the liver and muscles become less willing/able to absorb glucose out of the bloodstream, so it takes longer for the blood glucose to return to normal. When we get all the way to type II diabetes, there is something else going on. Earlier I talked about the process to deal with low blood glucose by converting liver glycogen to glucose. This normally only happens when blood glucose is low, but insulin resistance messes up the machinery that controls this, and the liver will release glucose even when glucose is normal or elevated. That is why the blood glucose is chronically high.

      The result is that those who are insulin resistant have chronically elevated levels of glucose and insulin, and since we know that elevated insulin reduces fat burning, they find it very hard to burn fat.

      Insulin resistance is not a binary thing, and it’s possible to be a little insulin resistant and not have it show up in standard tests. It is not confined to people who are overweight; it is possible to be insulin resistant and have a normal body weight.

      Summary

      Protein and fat digestion and storage are pretty simple, but because of the limited storage available for carbs, excess carbs just get stored as fat.

      Now that we’ve gotten that fat and glucose stored, in the next post we’re going to talk about how those are used by the muscles.

      Appendix

      This section contains some related information that isn’t necessary for the discussion but may be of interest…

      Protein and insulin

      I glossed over the relation of insulin to protein earlier in the post, but it comes up often enough I thought it was worth covering here.

      Insulin is a multipurpose storage hormone; not only does it signal the body to store glucose, it also signals it to store protein.

      But how can that work? Let’s perform a little thought experiment:

      We eat a high protein meal and the pancreas secretes insulin. That would cause the amino acids from the protein to be absorbed, but it would also tell the liver, muscle, and fat cells to pull glucose out of the bloodstream, and would therefore cause the blood glucose to plummet.

      Which would be bad.

      This is one of the simplifications that I made to keep things simpler. It turns out that the liver, muscle, and fat cells are not sensitive to the amount of insulin in the blood but rather to the ratio of insulin to glucagon in the bloodstream. Here’s a graph for what happens after a carbohydrate-rich meal:

      Image result for insulin glucagon protein meal

      Notice the inverse relationship between the insulin and glucagon values; this will move the insulin/glucagon ratio much higher so the glucose will be absorbed.

      Here’s what happens with a protein-rich meal:

      Image result for insulin glucagon protein meal

      There is a small insulin spike from the protein, but a large glucagon spike. That keeps the insulin/glucagon ratio low and blood glucose constant.


      Tell me more about trans fats…

      Trans fats are fats which have a specific chemical structure…

      Saturated fats are called “saturated” because they have as much hydrogen in them as possible, so they are very simple structurally; just like a long column. Because of that, they fit together very nicely and that is why saturated fats tend to be solids at room temperature.

      This picture shows three fatty acids; the top on is saturated, and notice how it is nice and straight.

      Unsaturated fats have fewer hydrogen molecules; at specific places in the chains of carbon atoms there are missing hydrogen atoms. Monounsaturated fats have one spot, polyunsaturated have two or more. The connections between those carbon atoms become what are called “double bonds”. One of the features of double bonds is that they are easier to break; that is why unsaturated and especially polyunsaturated fats go rancid easily, and that is why there is concern with using them for deep fat frying; those bonds can be broken, the broken parts can be oxidized, and you end up with a nasty compound called an “aldehyde”.

      Because of the physics of how things work, there are two ways that double bonds can occur. The “normal” way – the way that is found in the majority of unsaturated fatty acids – is what are called “cis” bonds. These bonds are at an angle, so unsaturated fats have one or kinks in their structure; see the middle fatty acid, which has two double bonds. Because of that kink, they don’t fit together very well, so they are liquids at room temperature.

      Where the first double bond occurs matters biologically; that is described by counting the number of carbon atoms before the first double bond, and that is known as the “omega” number. If we look at the picture, we will see 6 carbon atoms before the first double bond, so this is an omega-6 oil.

      Trans fats

      The fats that are produced by plants or animals are either saturated fats or unsaturated fats with cis bonds; that is why I called it the “normal” way.

      But there is another way that the double bond can occur; it is called a “trans” bond, and that is where the term “trans fat” comes from. Instead of a big kink, there is just a little jog in the structure. This turns out to be important biologically.

      There are some natural trans fats; it turns out that there are bacteria that can produce trans fats. These bacteria live primarily in ruminant animals, which means that if you eat dairy products like cheese or the flesh of ruminants, you will get some trans fats. It is not clear where the natural trans fats are problematic or not, but the research I’ve seen suggests that the answer is “probably not”.

      Which takes us to artificial trans fats. Producers of polyunsaturated vegetable oil wanted to expand their markets so they could sell more, but the usages of the oils were limited because they were oils. It was discovered that if you heat up polyunsaturated oils under high pressure where there is a lot of free hydrogen, you can “hydrogenate” them and make them more saturated. If you fully saturate them, you just end up with a saturated fatty acid that is the same as a saturated fat from plant or animal sources.

      But, if you take a polyunsaturated oil and partially saturate it – partially hydrogenate it – it turns out that some of the remaining double bonds will flip from “cis” to “trans”, and you have an artificial trans fat. Which is pretty bad.


      Pages:123